Univariate anomaly detection
Azure Univariate Anomaly Detection detects anomalies in your time series data with a single variable, for example temperature over time. You don't have to build a model to use the service. You just send your data to the anomaly detection API and it will return the predicted anomalies.
The data can be sent to the anomaly detection API in one of two ways:
- Batch inference - You can send a batch of data to the anomaly detection API and it will return the predicted anomalies for the data.
- Streaming inference - You can send data to the anomaly detection API one data point at a time. The anomaly detection API will return the predicted anomaly for the data point.
You can find out more Azure Anomaly Detection from the Azure Anomaly Detector documentation.
Update the Notebook environment config file
Using your favorite text editor, open the file Notebooks/.env and update the following values using the values from the deployment output that you saved in the previous section.
- storage_connection_string=
- anomaly_detector_endpoint=
- anomaly_detector_key=
- inference_telemetry_endpoint_url=
- inference_telemetry_endpoint_key=
Start the Jupyter Notebook server
Navigate to the
Notebooksfolder.Start the Jupyter Notebook server by running the following command:
jupyter notebookA browser window will open and display the Jupyter Notebook dashboard. Click on the
univariant_sql_inference.ipynbnotebook to open it. Note, the Notebook defaults to analyzing 7 days data for device hvac_simulatorRun the notebook cells one at a time. The notebook will walk you through the process of loading the data, training the model, and detecting anomalies.
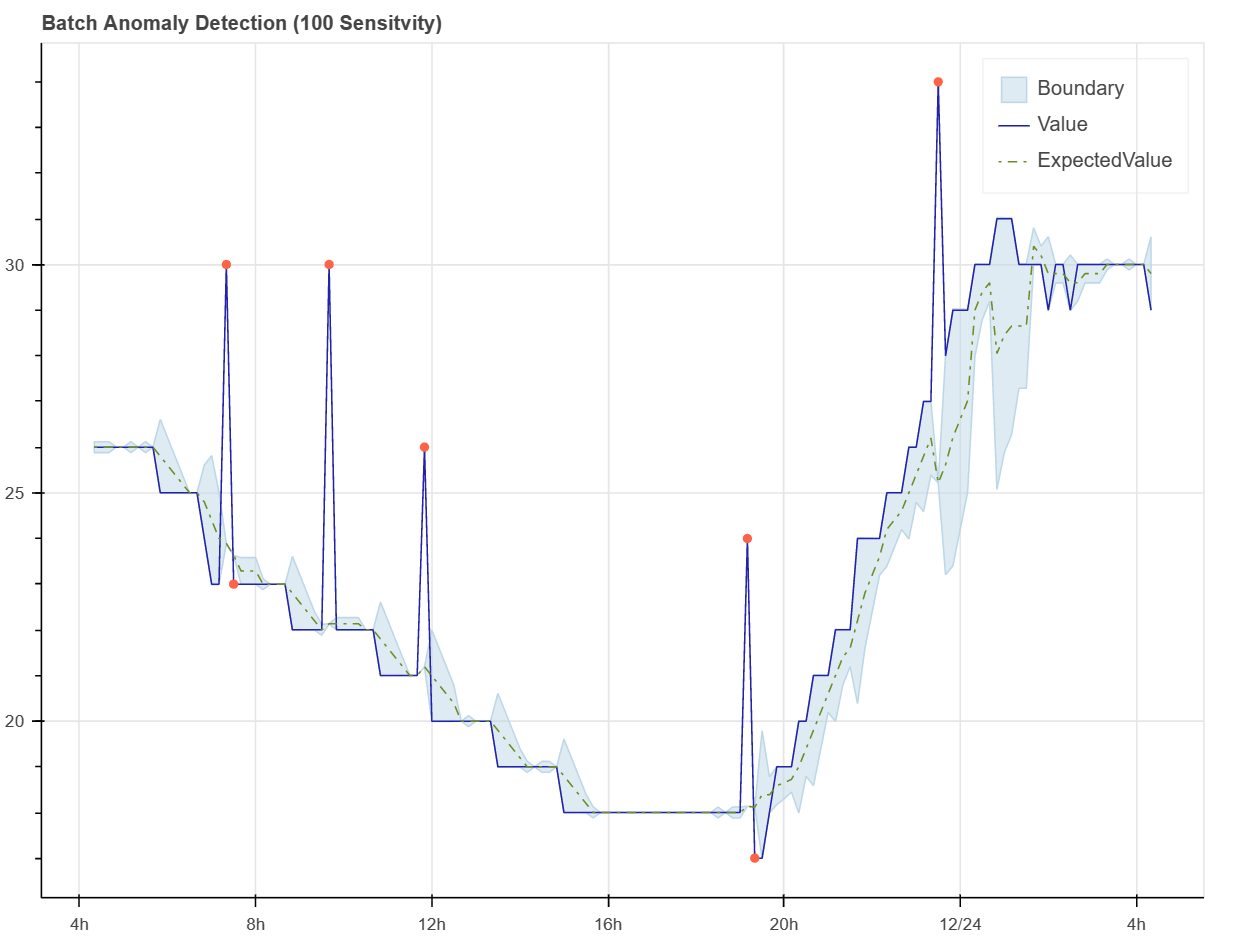
The notebook will show a plot of the predicted anomalies. The plot will show the predicted anomalies as red dots. The red circles are the actual anomalies that were generated by the HVAC simulator app. The red dots are the predicted anomalies generated by the anomaly detection model.
