PyLab 2: Raspberry Pi, Azure IoT Central, and Docker Container Debugging
Follow me on Twitter @dglover
| Author | Dave Glover, Microsoft Cloud Developer Advocate |
|---|---|
| Platforms | Linux, macOS, Windows, Raspbian Buster |
| Services | Azure IoT Central |
| Tools | Visual Studio Code |
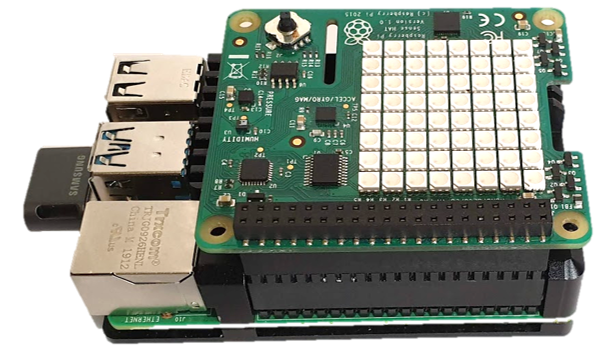
| Hardware | Raspberry Pi, Raspberry Pi Sense HAT |
| Language | Python |
| Date | September, 2019 |
PDF Lab Guide
You may find it easier to download and follow the PDF version of the Raspberry Pi, Python, Azure IoT Central, and Docker Container Debugging PyLab.
PyLab Content
- PyLab 1: Raspberry Pi, Debugging a Python Internet of Things Application
- PyLab 2: Raspberry Pi, Azure IoT Central, and Docker Container Debugging
Introduction
In this hands-on lab, you will learn how to create a Python Internet of Things (IoT) application with Visual Studio Code. Run the application in a Docker Container on a Raspberry Pi, read temperature, humidity, and air pressure telemetry from a sensor, and finally debug the application running in the Docker Container.
PyLab Set Up
Multi-User Set Up
The Multi-user set up allows up to 20 users/students per Raspberry Pi 4 4GB. A USB3 SSD or fast Flash drive is required to support the disk IO requirements for this number of users. The installation script installs the lab content, and Docker. Builds the lab Docker Images, and sets up all the users.
Software Installation

This hands-on lab uses Visual Studio Code. Visual Studio Code is a code editor and is one of the most popular Open Source projects on GitHub. It runs on Linux, macOS, and Windows.
Install Visual Studio Code
- Install Visual Studio Code
Visual Studio Code Extensions
The features that Visual Studio Code includes out-of-the-box are just the start. VS Code extensions let you add languages, debuggers, and tools to your installation to support your development workflow.
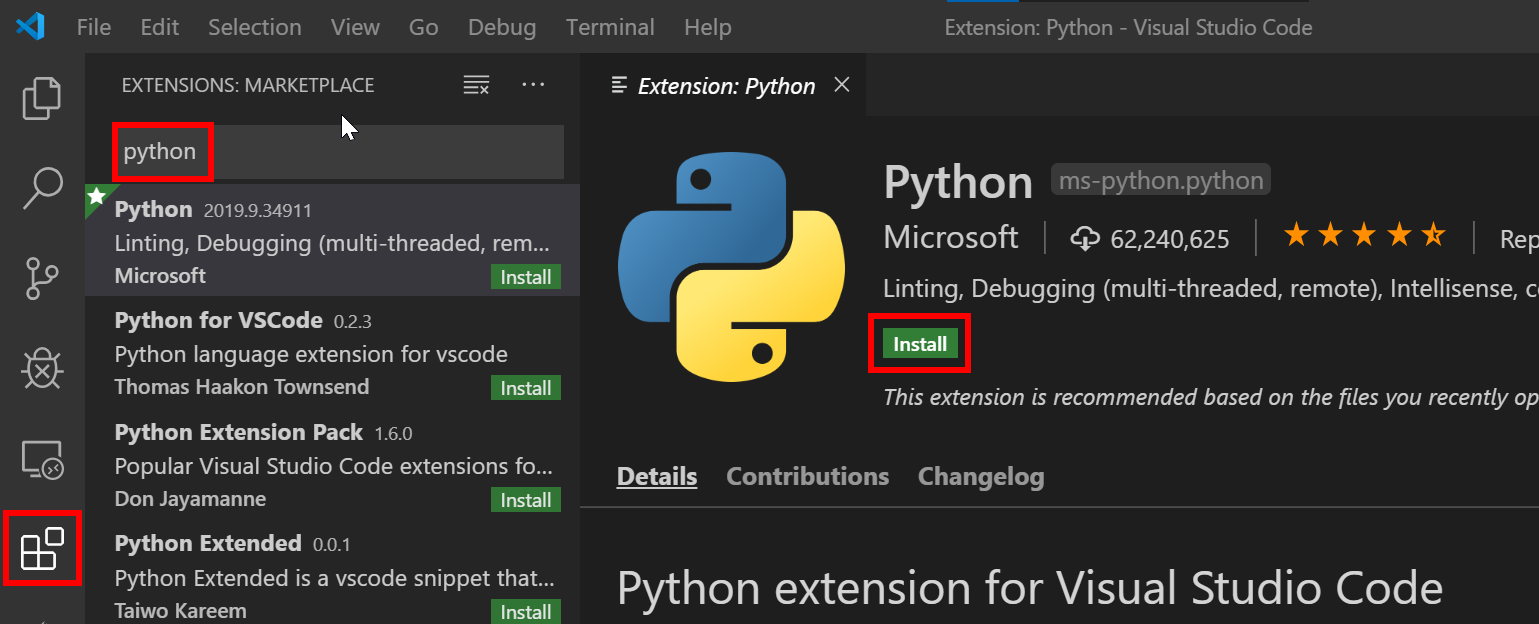
Browse for extensions
You can search and install extensions from within Visual Studio Code. Open the Extensions view from the Visual Studio Code main menu, select View > Extensions or by clicking on the Extensions icon in the Activity Bar on the side of Visual Studio Code.
![]()
This will show you a list of the most popular VS Code extensions on the VS Code Marketplace.
Install the Python, Remote SSH, and Docker Extensions
Search and install the following two Visual Studio Code Extensions published by Microsoft.
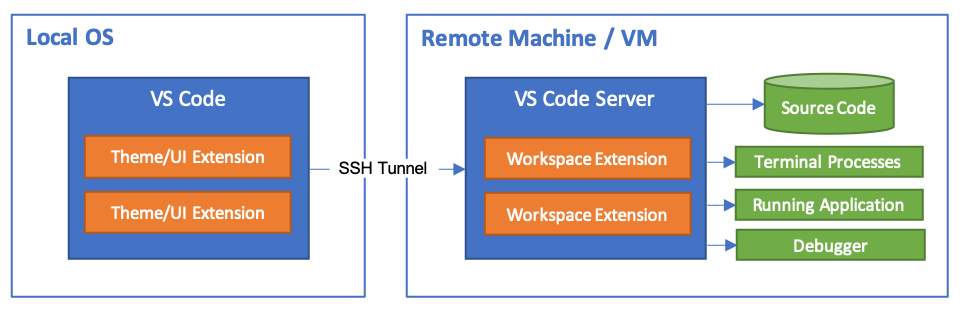
Remote SSH Development
The Visual Studio Code Remote - SSH extension allows you to open a remote folder on any remote machine, virtual machine, or container with a running SSH server and take full advantage of Visual Studio Code.
Raspberry Pi Hardware
You need the following information:
- The Network Address of the Raspberry Pi
- Your Raspberry Pi login name and password.
SSH Authentication with private/public keys

Setting up a public/private key pair for SSH authentication is a secure and fast way to authenticate from your computer to the Raspberry Pi. This is recommended for this hands-on lab.
SSH Set up for Windows Users
The SSH utility guides you through the process of setting up a secure SSH channel for Visual Studio Code and the Raspberry Pi.
You will be prompted for:
- The Raspberry Pi Network IP Address,
- The Raspberry Pi login name and password
-
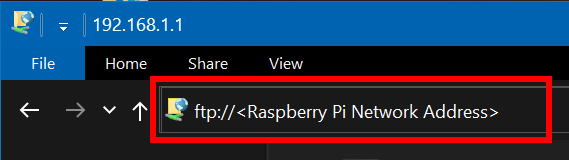
From Windows File Explorer, open ftp://<Raspberry Pi Address>
-
Copy the scripts directory to your desktop
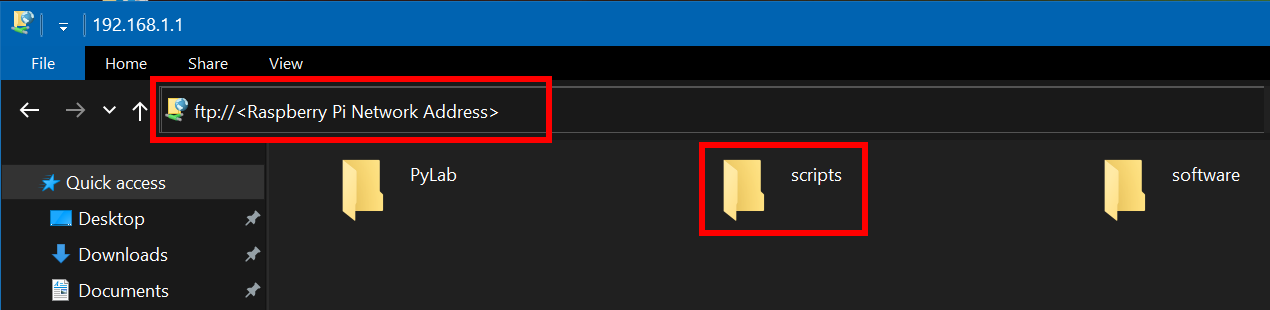
- Open the scripts folder you copied to your desktop
- Double click the windows-setup-ssh.cmd
SSH Set up for Linux and macOS Users
The SSH utility guides you through the process of setting up a secure SSH channel for Visual Studio Code and the Raspberry Pi
You will be prompted for:
- The Raspberry Pi Network IP Address,
- The Raspberry Pi login name and password
- Open a Terminal window
-
Copy and paste the following command, and press ENTER
 read -p "Enter the Raspberry Pi Address: " pyurl && \
 curl ftp://$pyurl/scripts/ssh-setup.sh | bash
Start a Remote SSH Connection
- Start Visual Studio Code
-
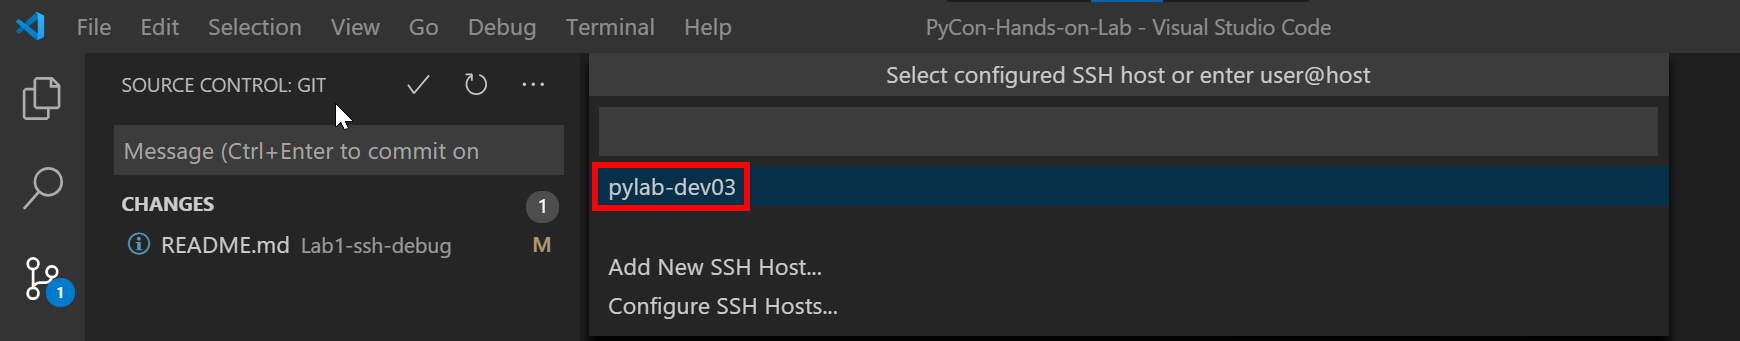
Press F1 to open the Command Palette, type ssh connect and select Remote-SSH: Connect to Host
-
Select the pylab-devnn configuration
-
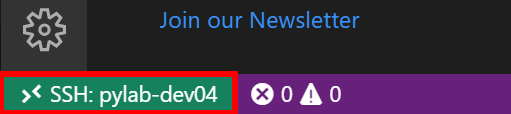
Check the Remote SSH has connected.
It will take a moment to connect, then the SSH Status in the bottom lefthand corner of Visual Studio Code will change to >< SSH:pylab-devnn. Where devnn is your Raspberry Pi Login name.
Introduction to Docker
Jake Wright’s Docker in 12 Minutes is a great introduction to Docker.
![]()
Open the PyLab 2 Docker Debug Project
- From Visual Studio Code main menu: File > Open Folder
-
Select the PyLab directory
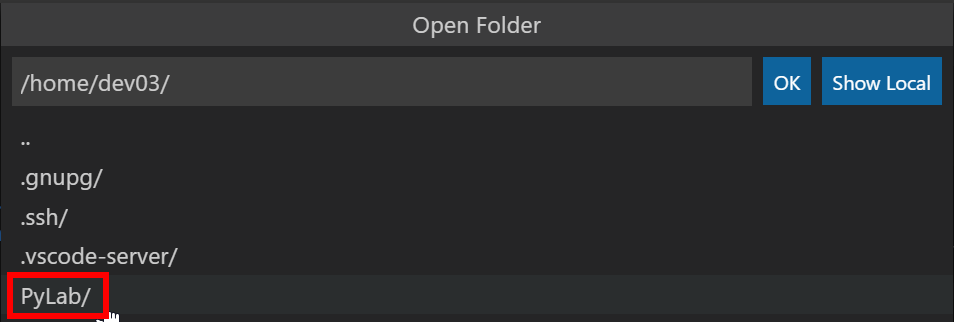
-
Next select, the PyLab-2-Docker-Debug/ directory
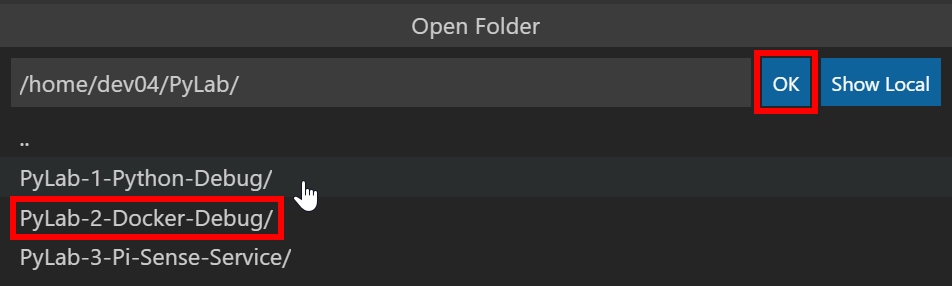
- Click OK to Open the directory
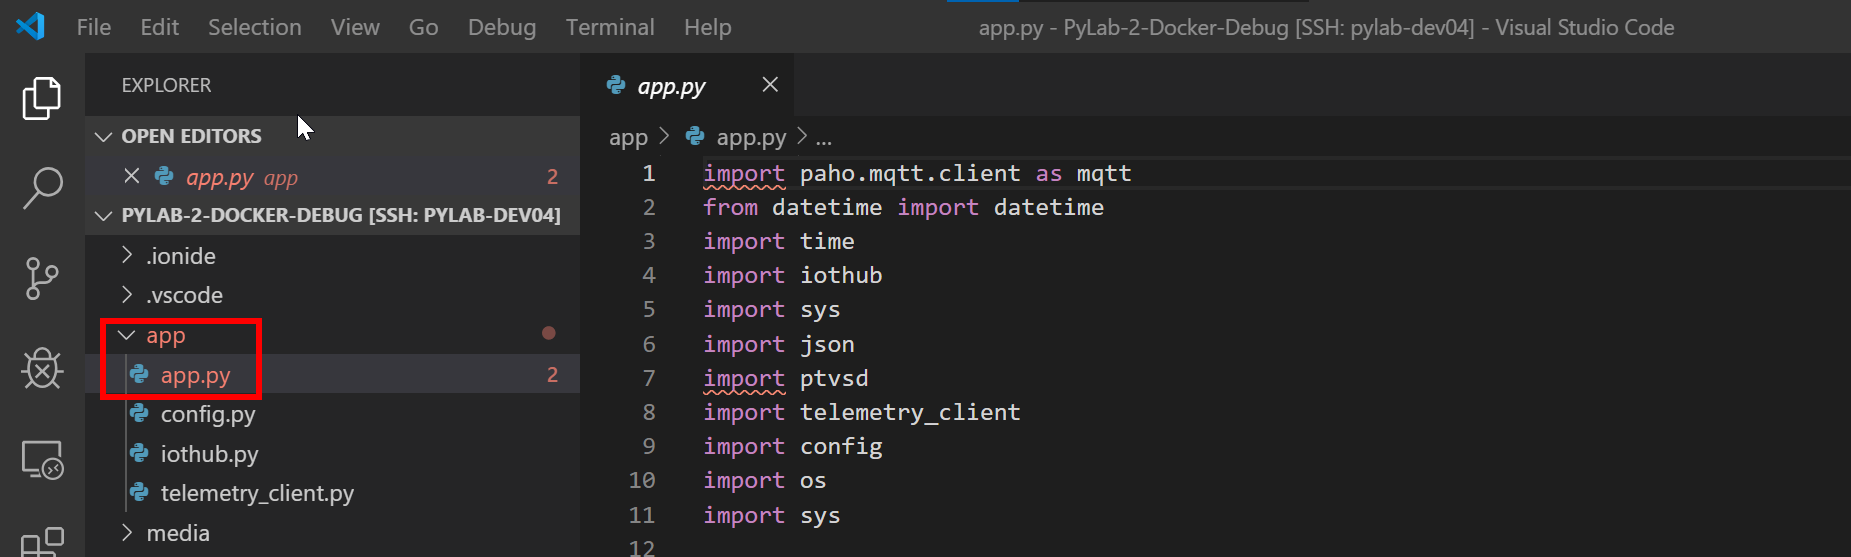
-
From the Explorer bar, open the app folder, then the app.py file, and review the contents
Creating an Azure IoT Central Application
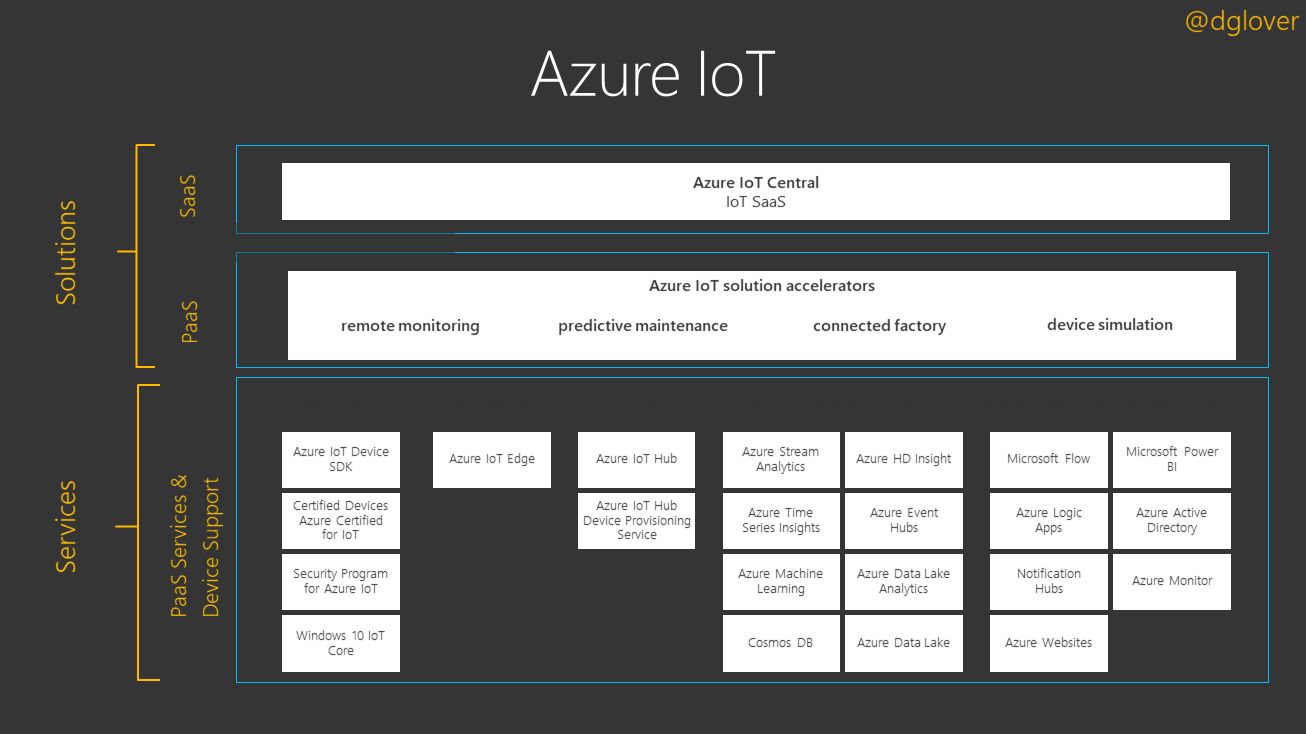
What is Azure IoT Central
Easily connect, monitor and manage your Internet of Things (IoT) assets at scale. Azure IoT Central is a hosted, extensible software as a service (SaaS) platform that simplifies setup of your IoT solution and helps reduce the burden and costs of IoT management, operations and development. Provide customers superior products and service while expanding your business possibilities.
We are going to create an Azure IoT Central application, then a device, and finally a device connection string needed for the application that will run in the Docker container.
Create a New IoT Central Application
-
Open the Azure IoT Central in a new browser tab, then click Getting started.
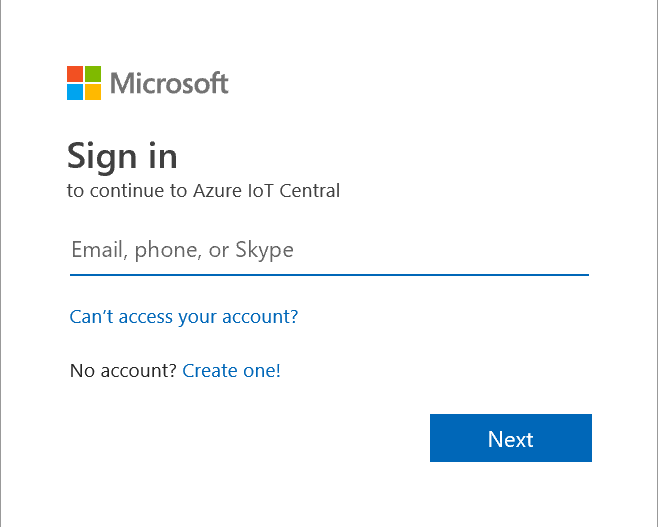
-
Next, you will need to sign with your Microsoft Personal, or Work, or School account. If you do not have a Microsoft account, then you can create one for free using the Create one! link.
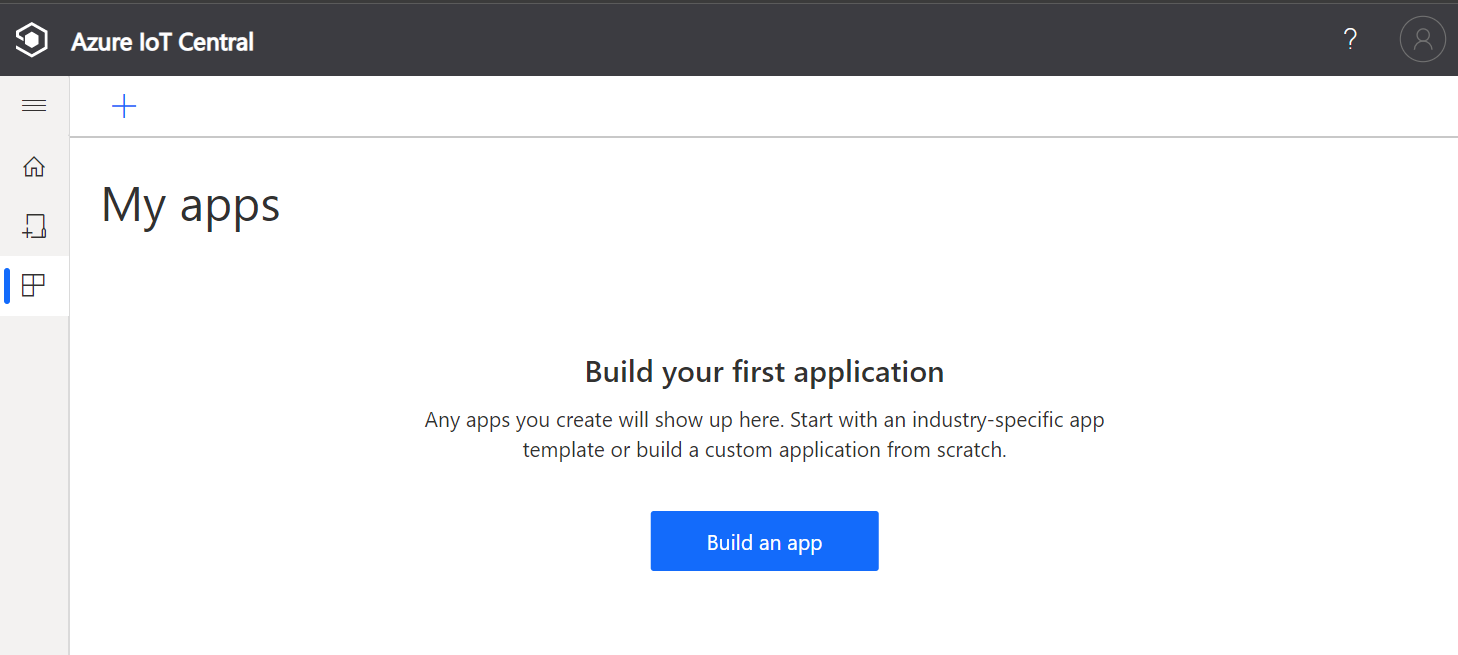
-
Create a new Azure IoT Central application, select New Application. This takes you to the Create Application page.
-
Select Build as app
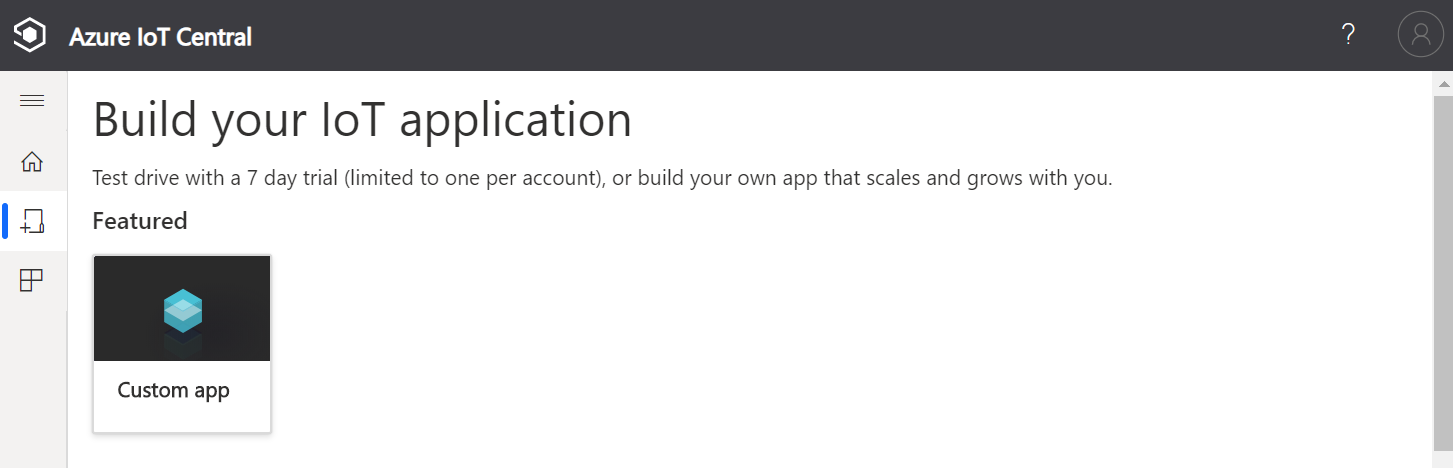
-
Select Custom app
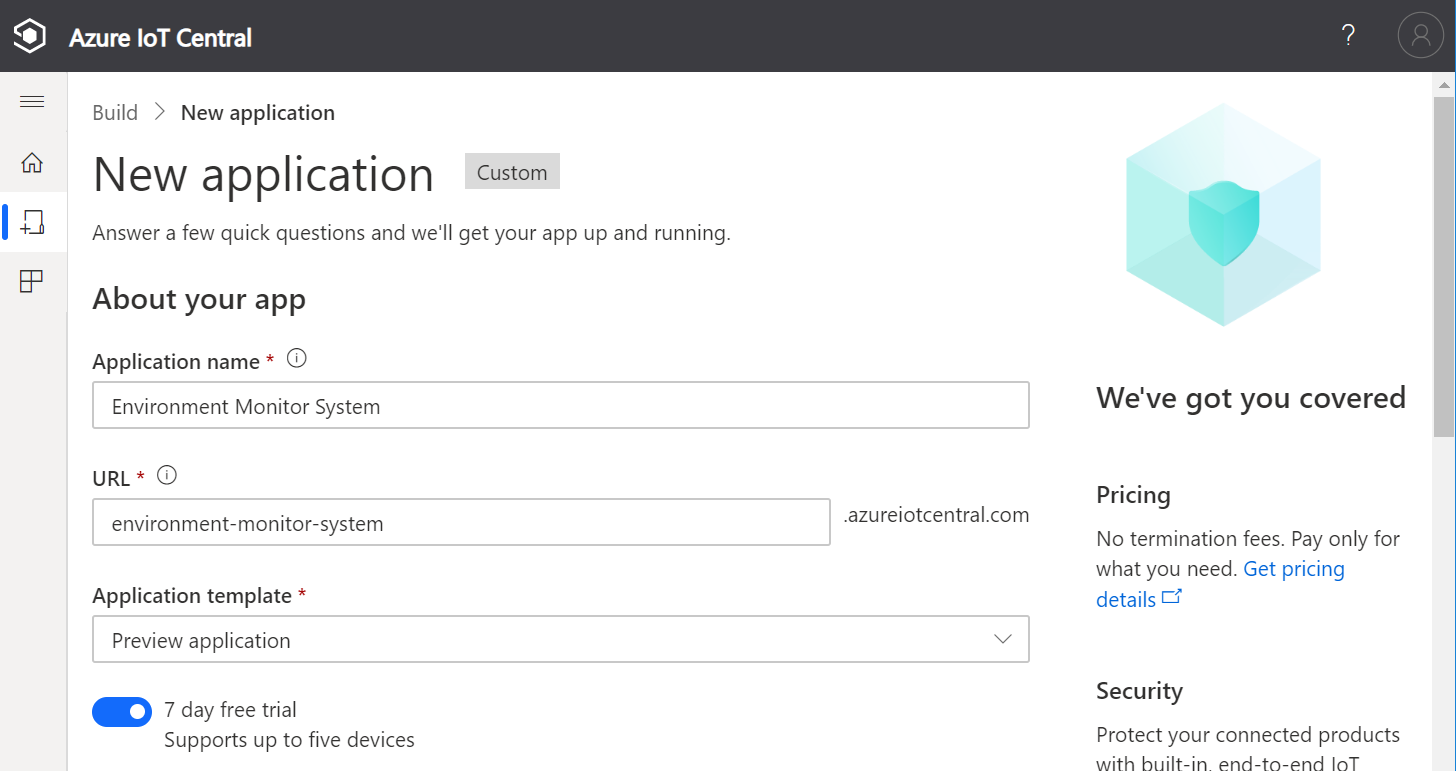
Create a New application
Specify Application name, URL, enable 7 day free trial, and complete the registration form. Then click Create.
-
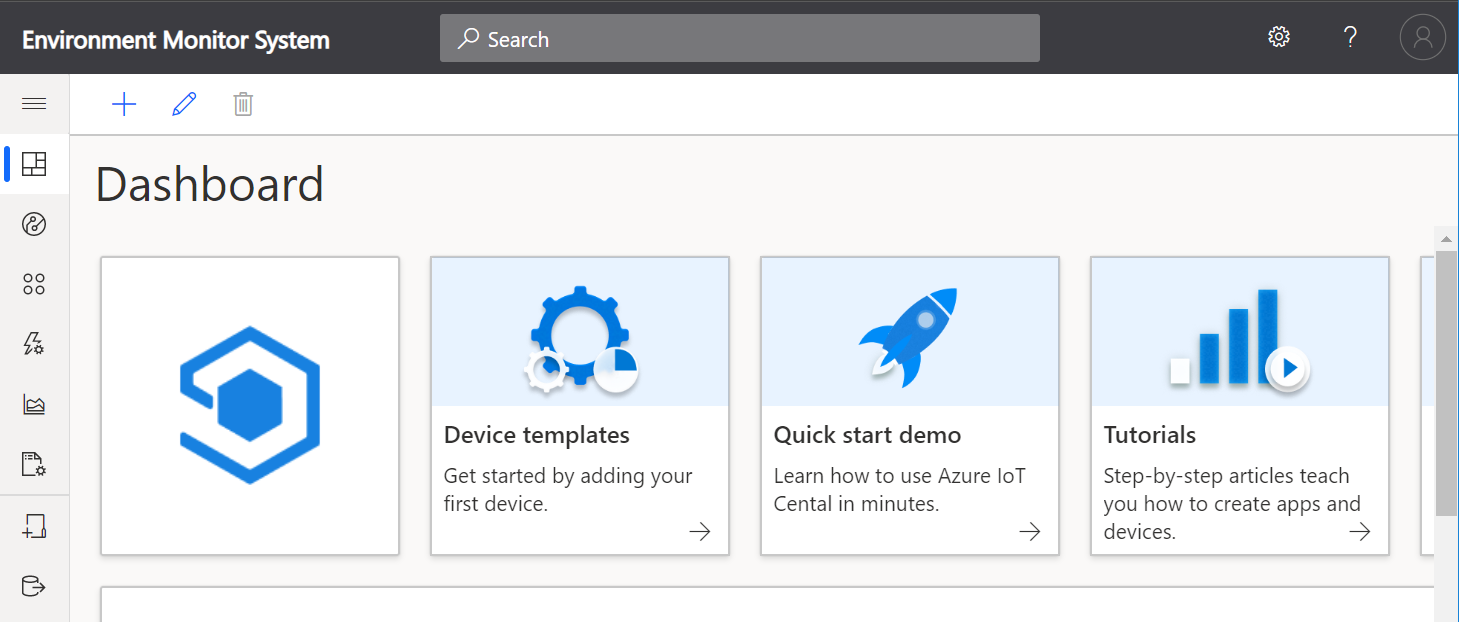
Add new Device Template
Click Device templates
-
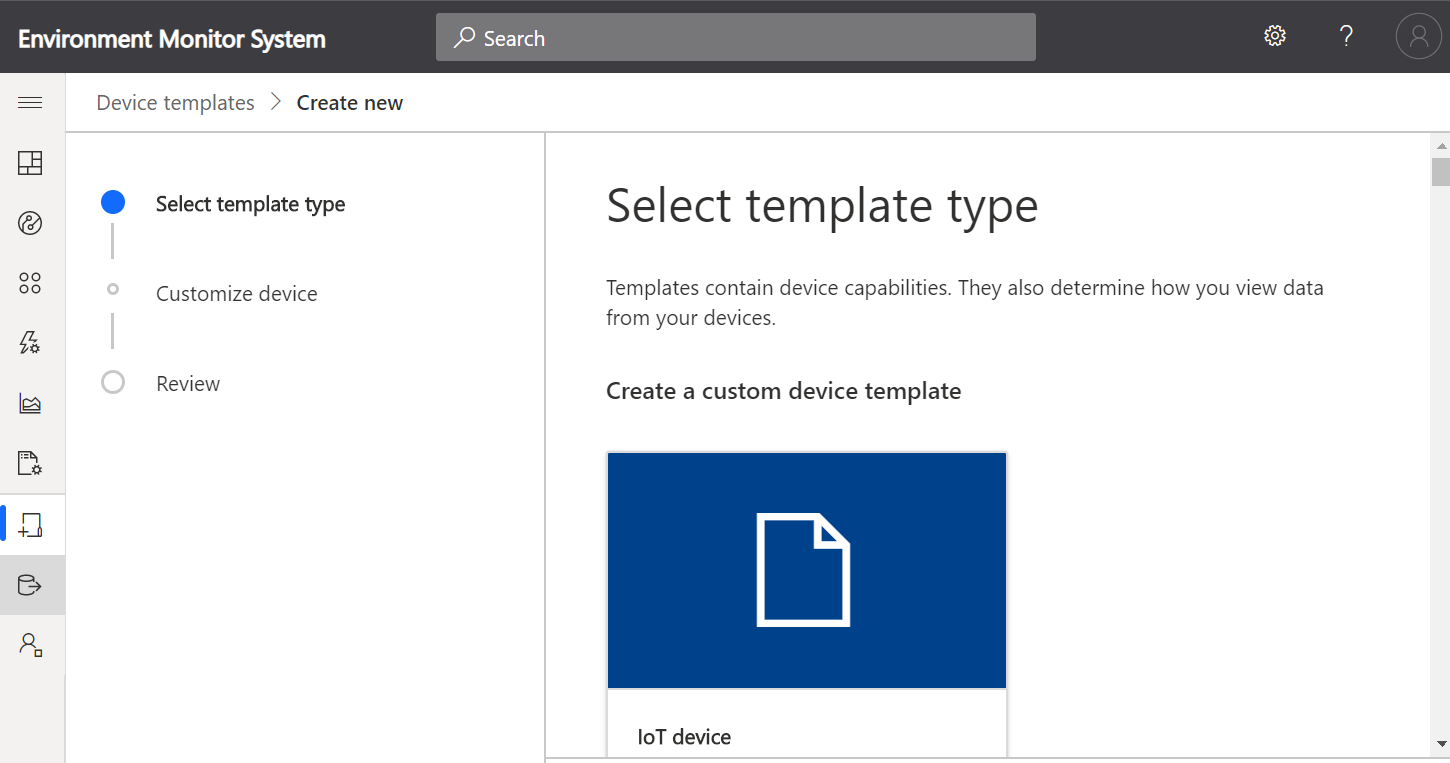
Select IoT device template type
-
Create an IoT Device Template
- Select IoT device,
- Click Next:Customise,
- Click Next: Review,
- Click Create.
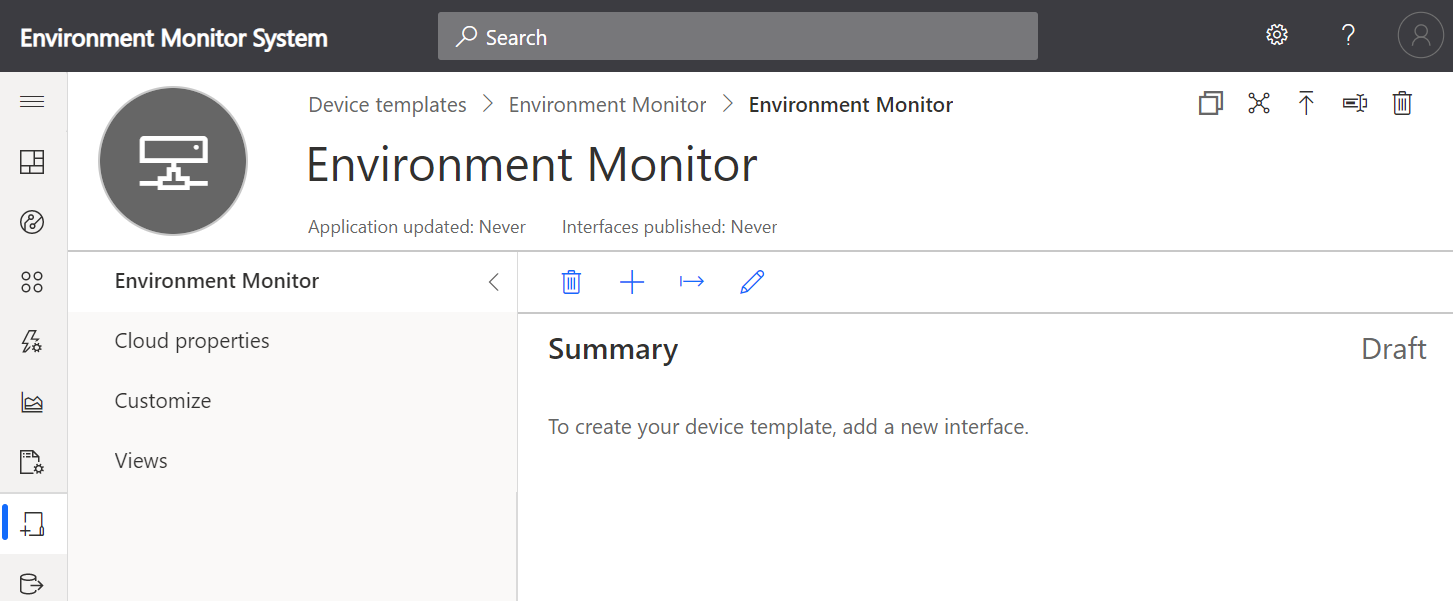
- Name your template, and press Enter
Create a Capability Model
-
Add an Interface
- Click Custom,
- Click the + symbol to add an Interface.
- Choose Custom interface.
-
Add Capabilities
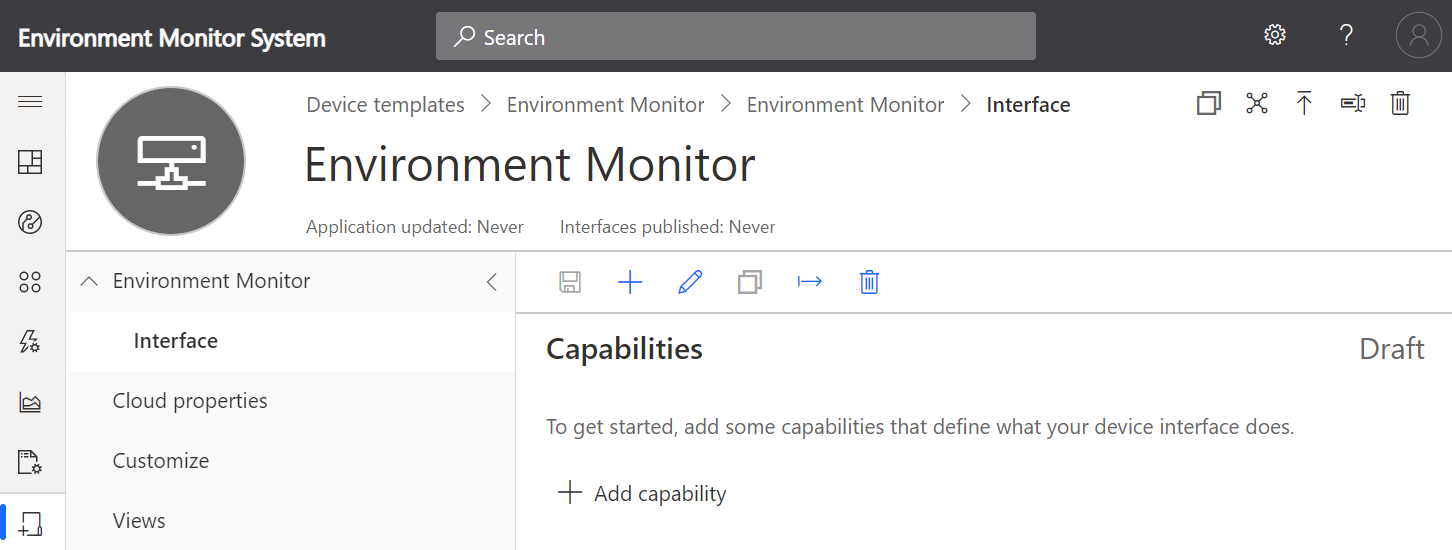
Click < (Collapse) to create more working space.
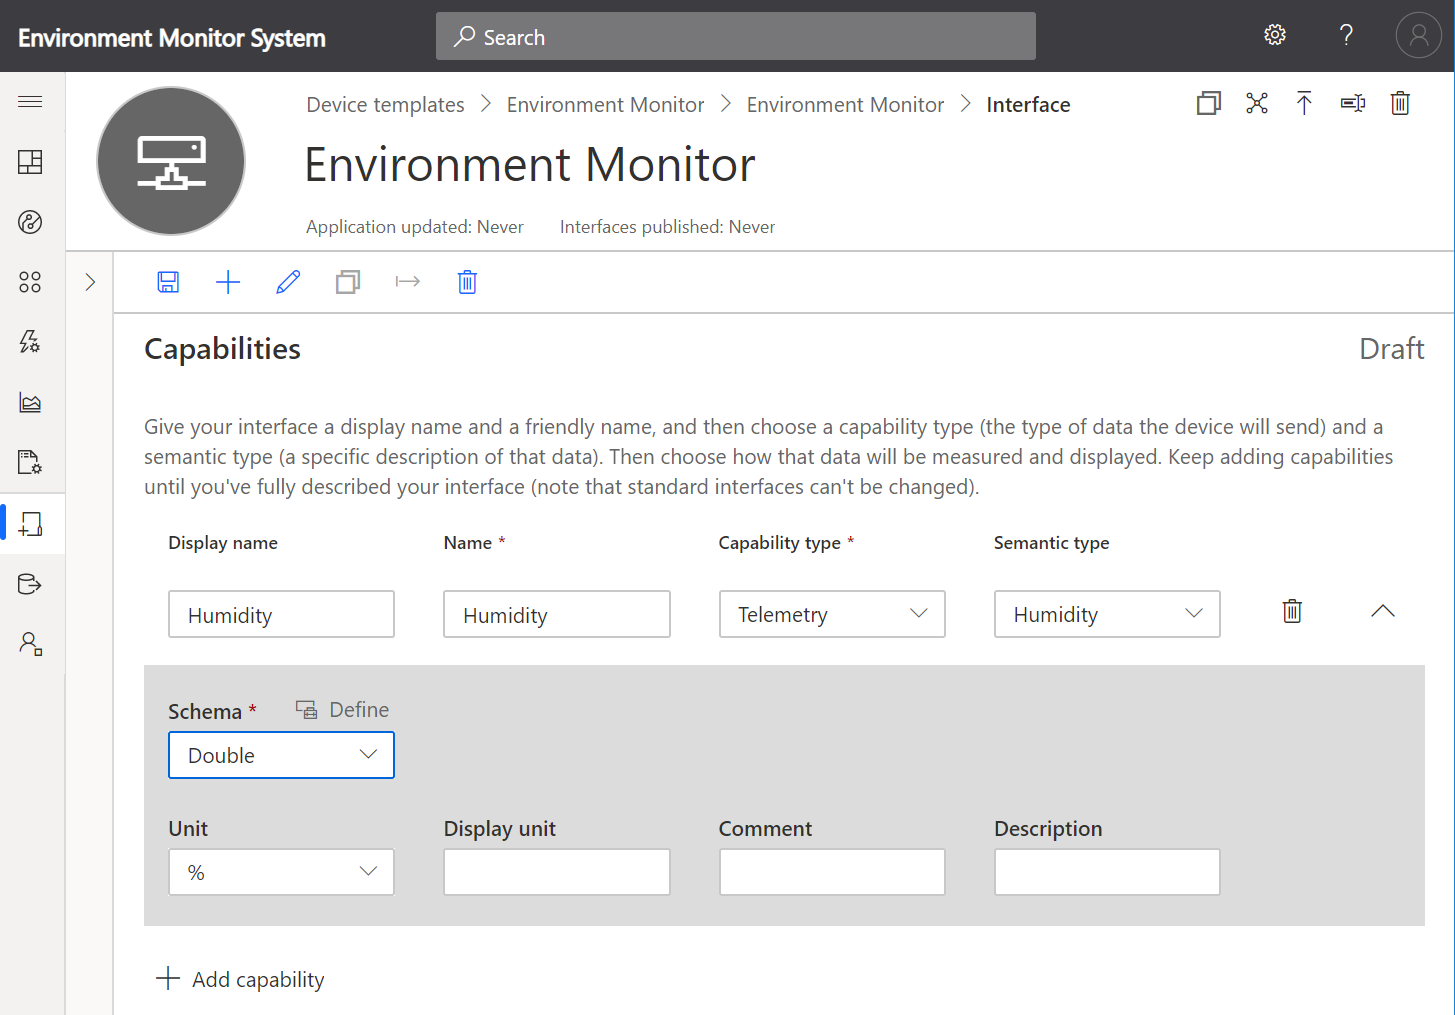
- Add Humidity Capability
- Click + to Add capability.
- Add Humidity Telemetry Capability
- Set the Unit to %
-
Add Temperature and Pressure Capabilities

-
Save the Capabilities
Click Save to save the capabilities model.
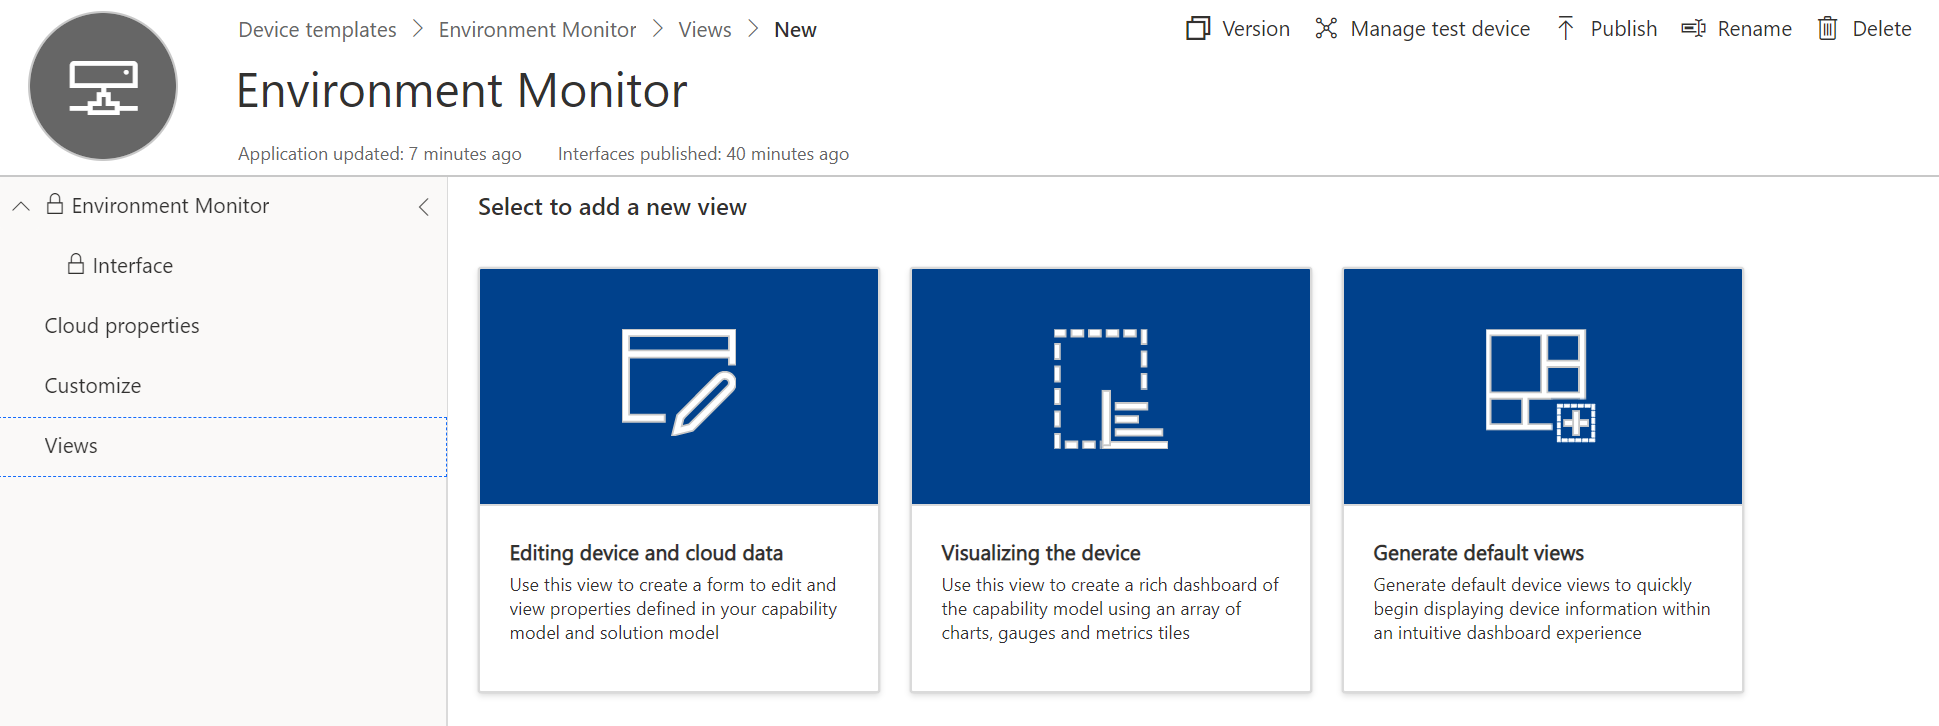
Create a Device Template View
- Click Views
- Click Generate default views
- Click Generate default dashboard view(s)
-
You can customize the default view later.
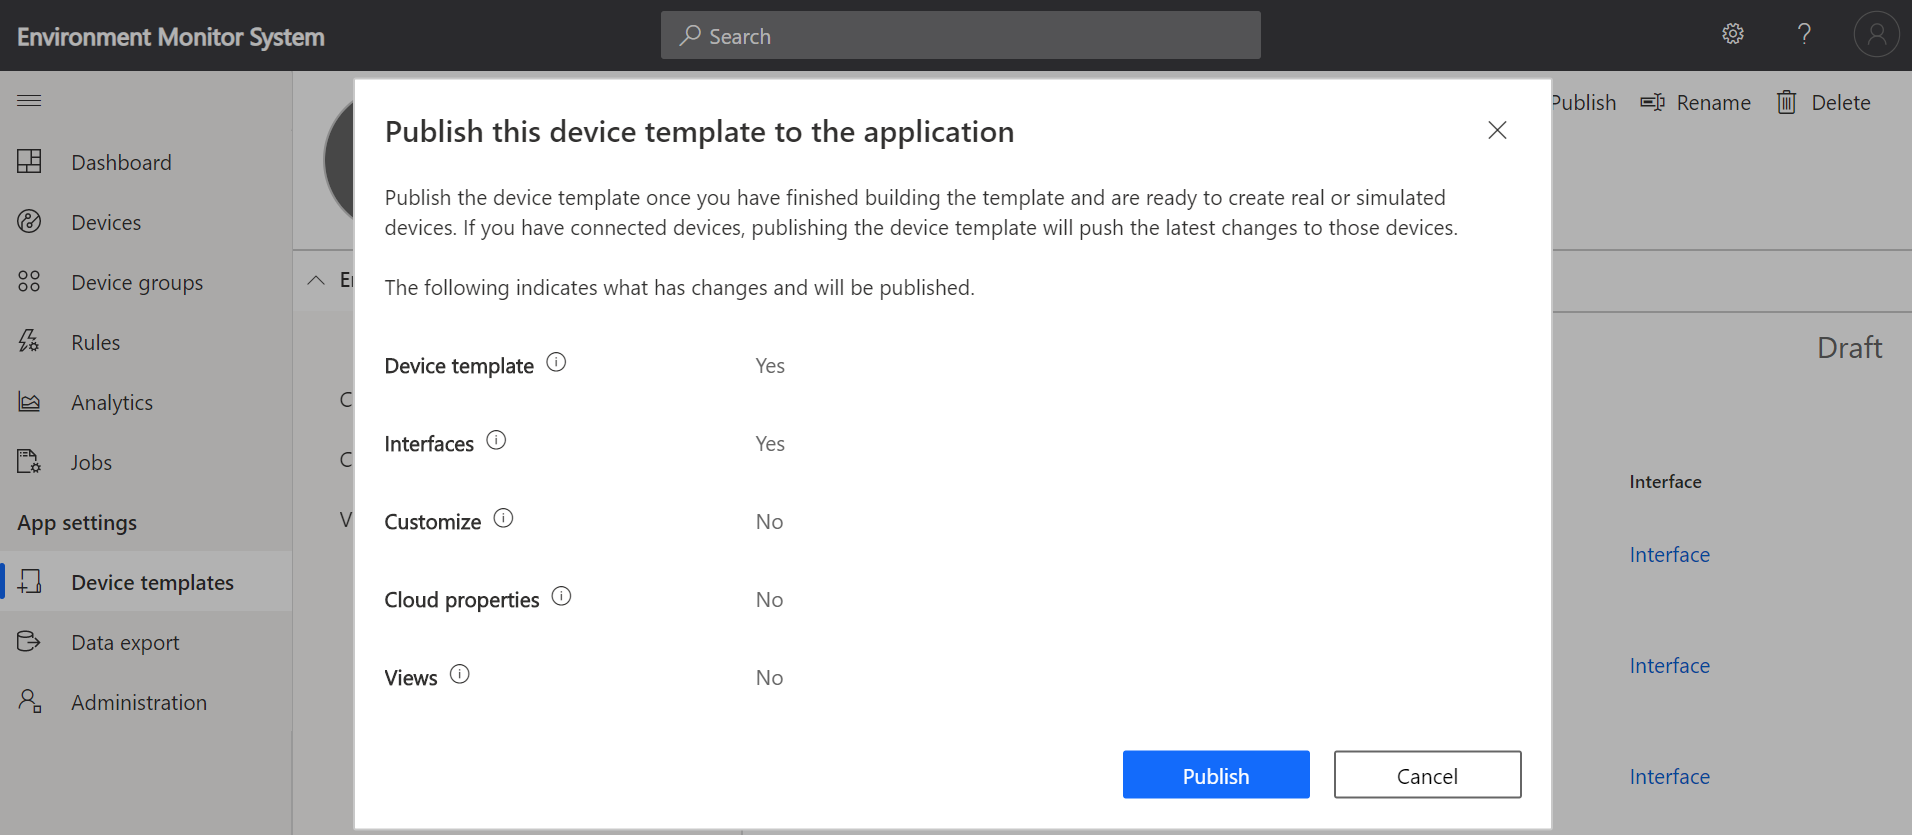
Publish the Template
Click Publish to activate the template, the click Publish.
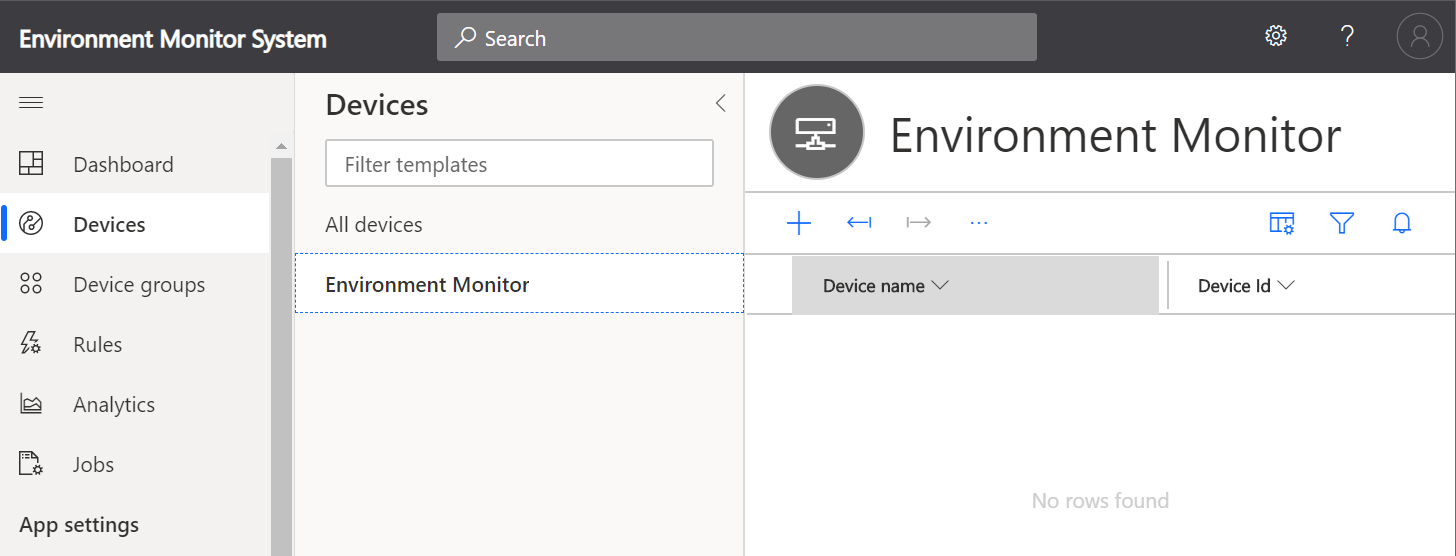
Create a new device
- Select Devices from IoT Central Side Bar menu
-
Select the Template you just created
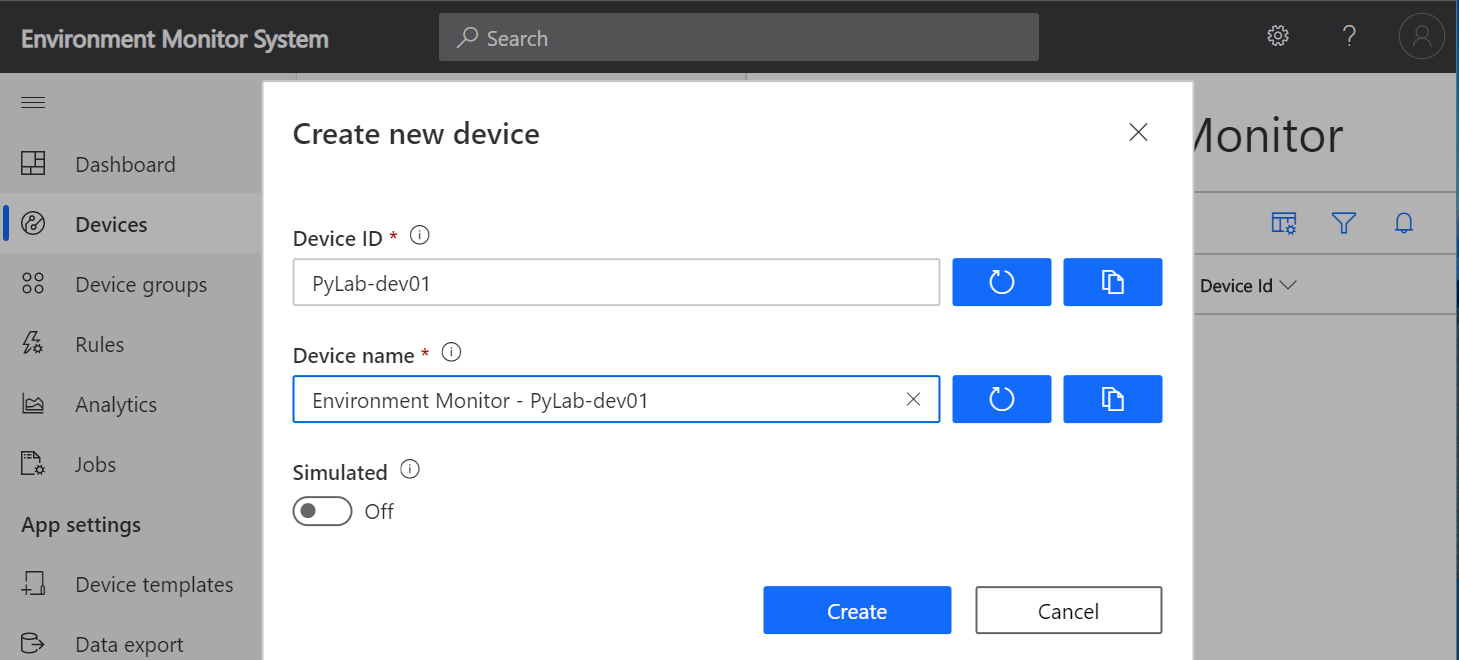
-
Click + to add a new device
- Set the Device ID and the Display name
- Click Create
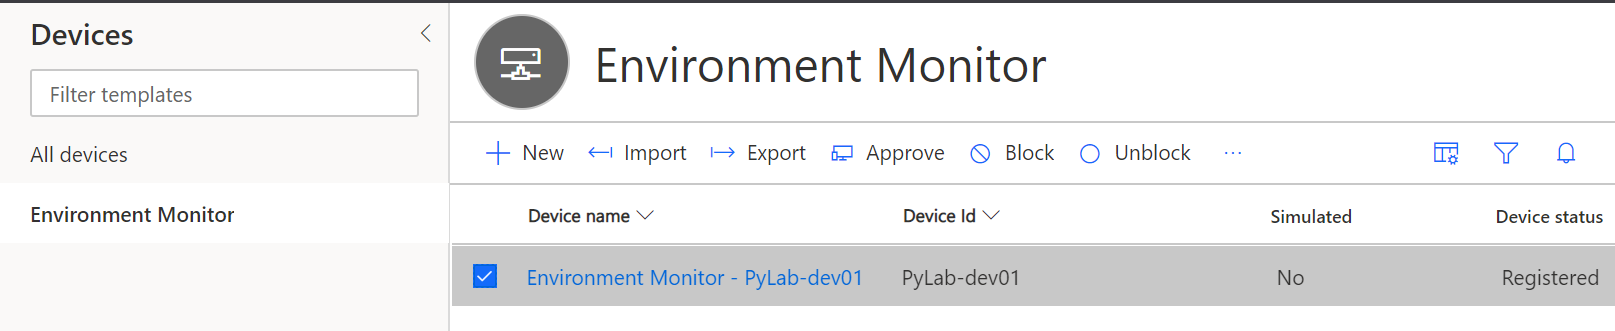
Approve the device
- Select the newly created device
-
Click Approve
Connect the Device
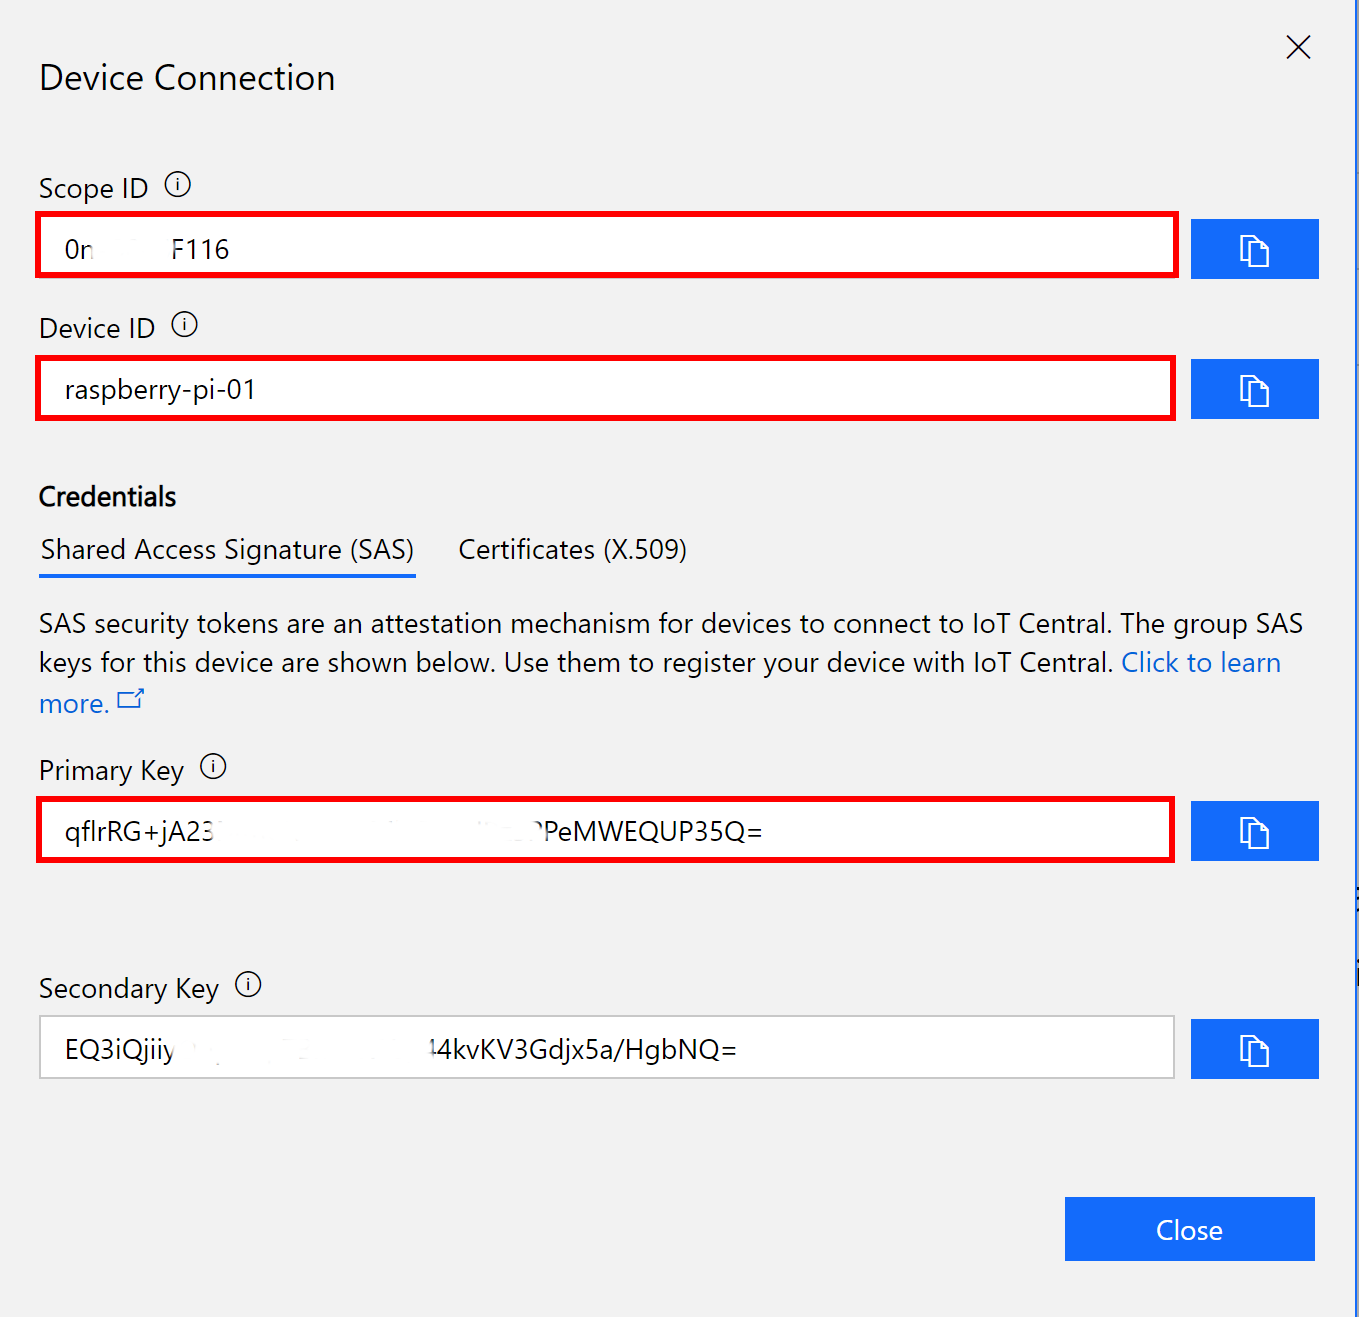
When you have created your real device click the Connect button in the top right-hand corner of the screen to display the device credentials.
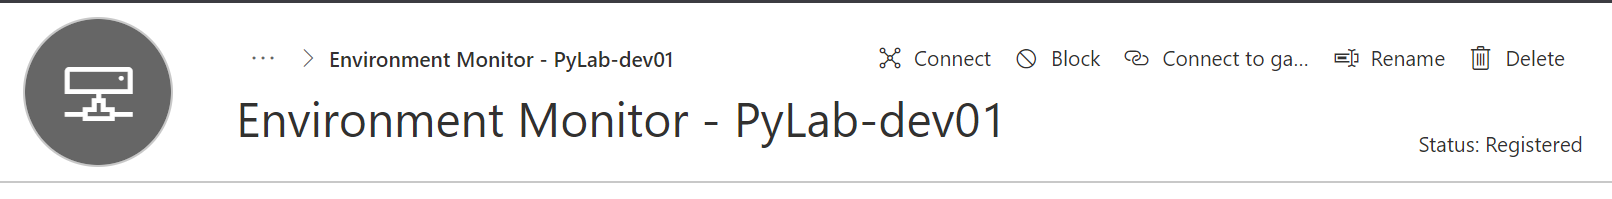
Leave this page open as you will need this connection information for the next step in the hands-on lab.
Configure the Python Application
-
Switch back to Visual Studio Code. Open the env-file (environment file). This file contains environment variables that will be passed to the Docker container.
-
Paste the Scope ID, Device ID, and Primary Key into the env-file.
For example (don’t try to use the sample values in the example as they will not work):
SCOPE=0ne00012345 DEVICE_ID=rpi-device KEY=dB0g7hikas9isvYfYkqCofRpFl7VoXCGuuNOvCa1aK8= -
Save the env-file file (Ctrl+S)
How Debugging a Python App in a Docker Container Works
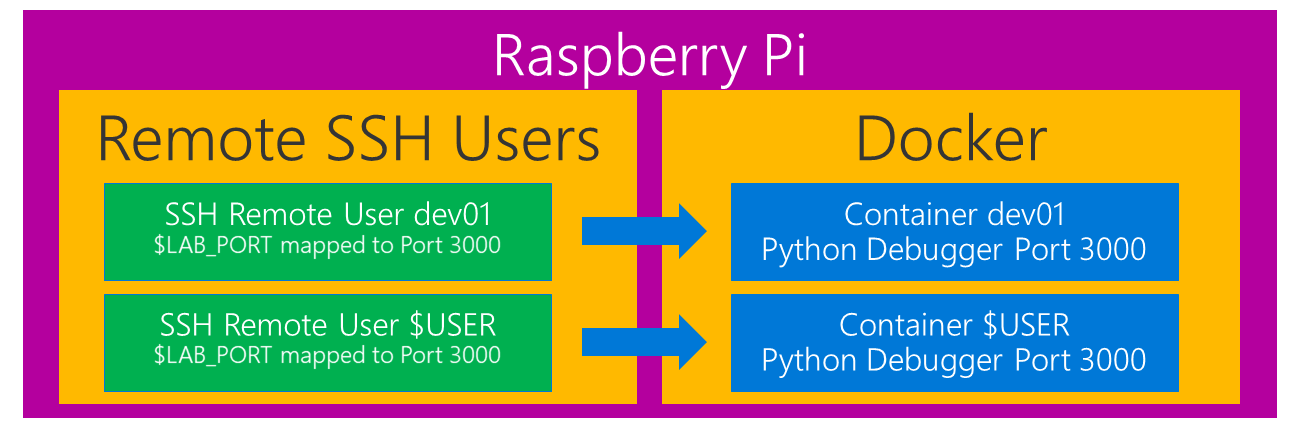
- Each User Profile ($USER) has a Unique ($LAB_PORT) Environment Variable that is set when you log into the Raspberry Pi (.bashrc).
-
The follow happens when you start a Visual Studio Code Docker container debug session:
- A Docker container named $USER is built to include your Python Code (docker build)
- Docker maps $LAB_PORT to Port 3000 in the container (-p $LAB_PORT:3000). If you review the .vscode/task.json file you will see the Docker commands that run when you start the debugger.
- The Docker Container is started (docker run –p $LAB_PORT:3000)
-
One of the first lines of code in the app.py file is to start the ptvsd (Python Tools for Visual Studio Debugger) debugger to listen on port 3000.
ptvsd.enable_attach(address=('0.0.0.0', 3000)) - Next the Visual Studio Code debugger attaches to $LAB_PORT that is mapped through to port 3000. This is the port that the Visual Studio Python Debugger is listening on in the container. Review the .vscode/launch.json file to understand how the debugger attach works.
- Now you can start stepping through the Python code, set breakpoints, inspect variables etc.
Build and Run the Docker Image
Press F5 to start debugging the Python application. The process will first build and then start the Docker Container. When the Docker Container has started the Visual Studio Code Debugger will attach to the running application.
There are two configuration files found in the .vscode folder that are responsible for running and debugging the Python application. You can find more detail the Debugger Configuration appendix.
Set a Visual Studio Debugger Breakpoint
- From Explorer on the Visual Studio Code activity bar, open the app.py file
-
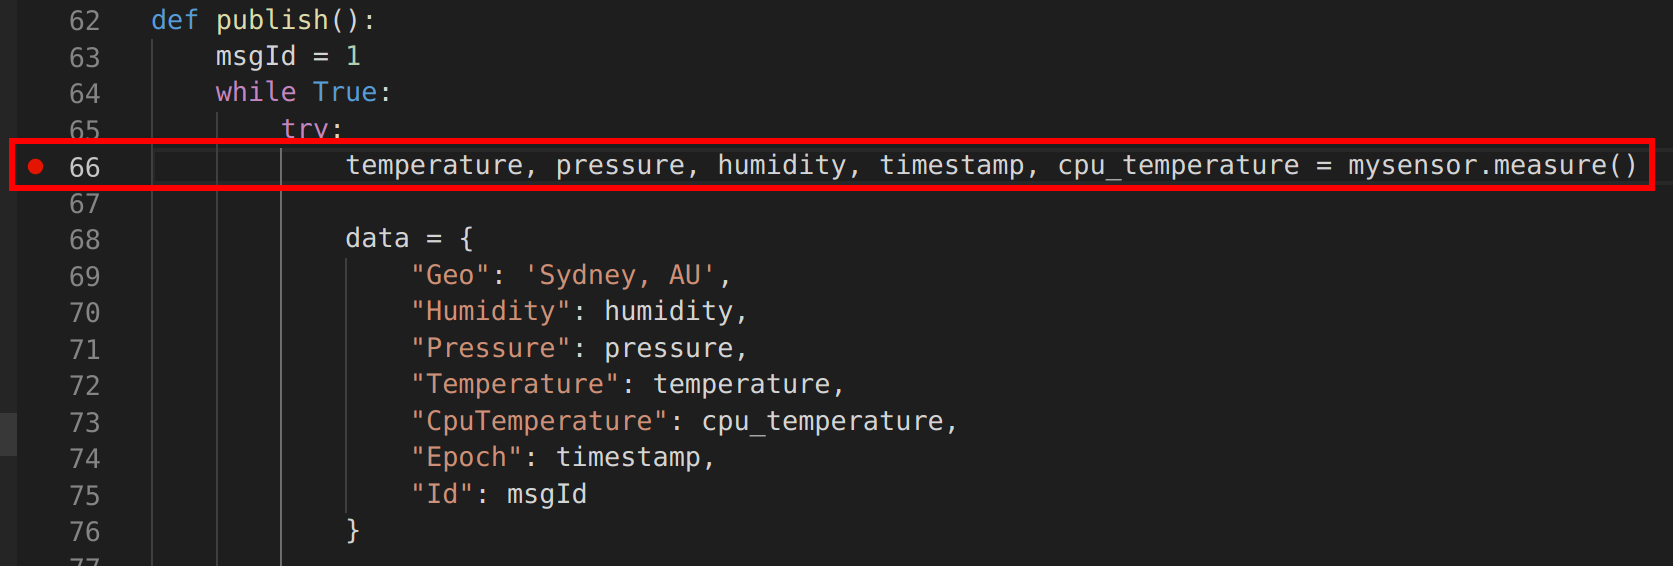
Set a breakpoint at line 66, temperature, pressure, humidity, timestamp = mysensor.measure() in the publish function.
-
You can set a breakpoint by doing any one of the following:
- With the cursor on that line, press F9, or,
- With the cursor on that line, select the Debug > Toggle Breakpoint menu command, or, click directly in the margin to the left of the line number (a faded red dot appears when hovering there). The breakpoint appears as a red dot in the left margin:
-
Debug actions
Once a debug session starts, the Debug toolbar will appear at the top of the editor window.
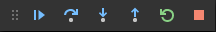
The debugger toolbar (shown above) will appear in Visual Studio Code. It has the following options:
- Pause (or Continue, F5),
- Step Over (F10)
- Step Into (F11),
- Step Out (Shift+F11),
- Restart (Ctrl+Shift+F5),
- and Stop (Shift+F5).
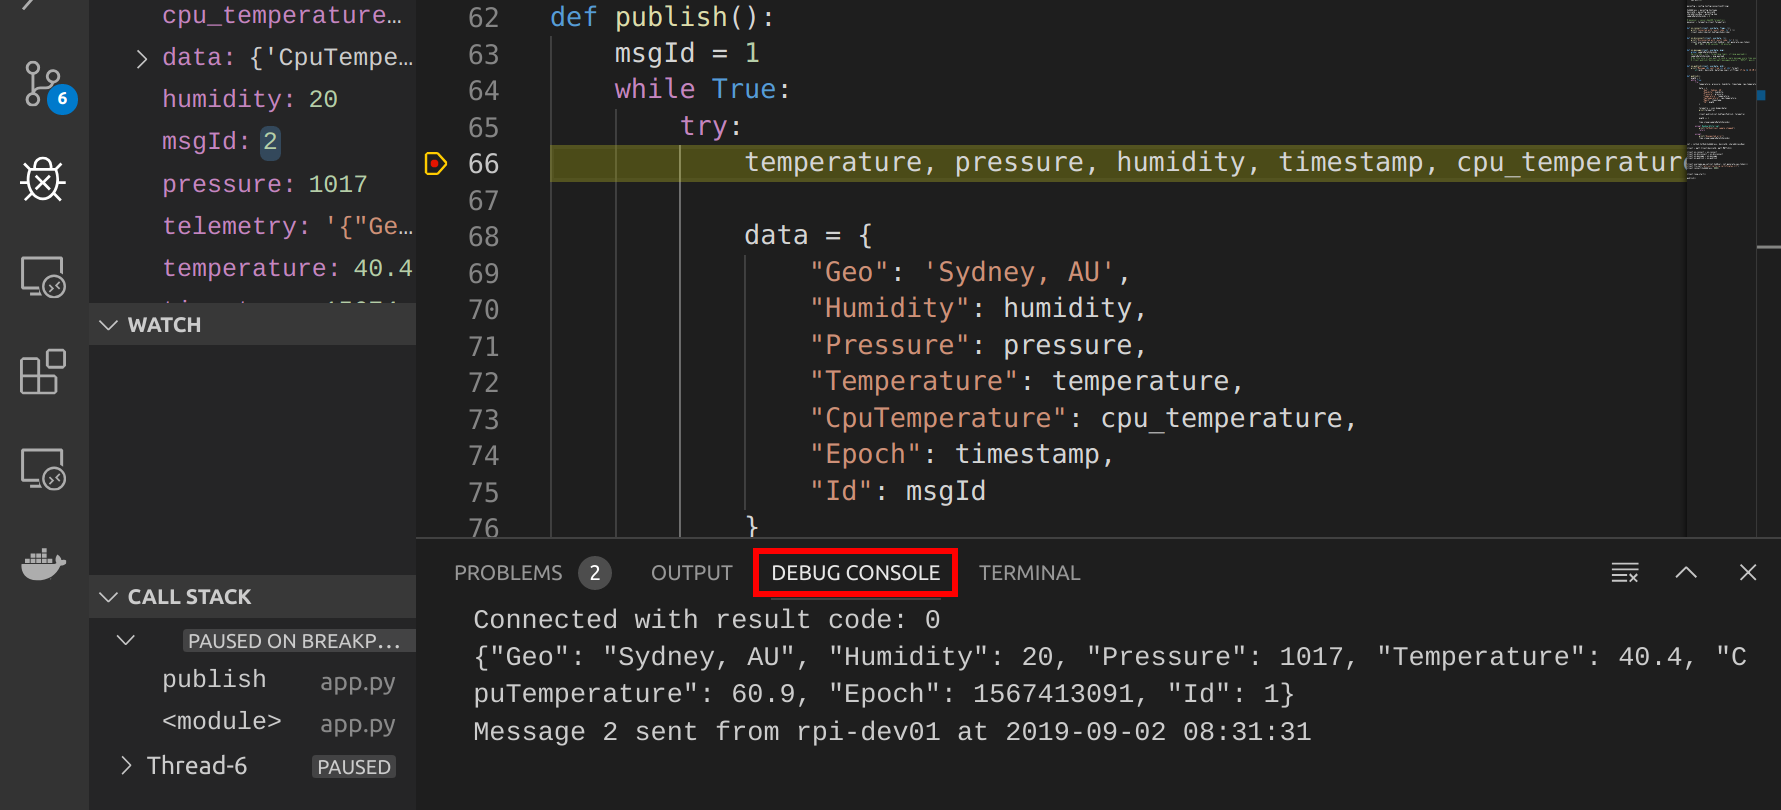
Step through the Python code
- Press F10, or from the Debugger Toolbar, click Step Over until you are past the print(telemetry) line of code.
- Explore the Variable Window (Ctrl+Shift+Y). Try changing variable values.
- Explore the Debug Console. You will see sensor telemetry and the results of sending the telemetry to Azure IoT Central.
- From the Debug Menu -> Disable All Breakpoints
- Press F5 or from the Debugger Toolbar, click Continue so the Python application runs and streams telemetry to Azure IoT Central.
Exploring Device Telemetry in Azure IoT Central
-
Use Device to navigate to the Measurements page for the real Raspberry Pi device you added:
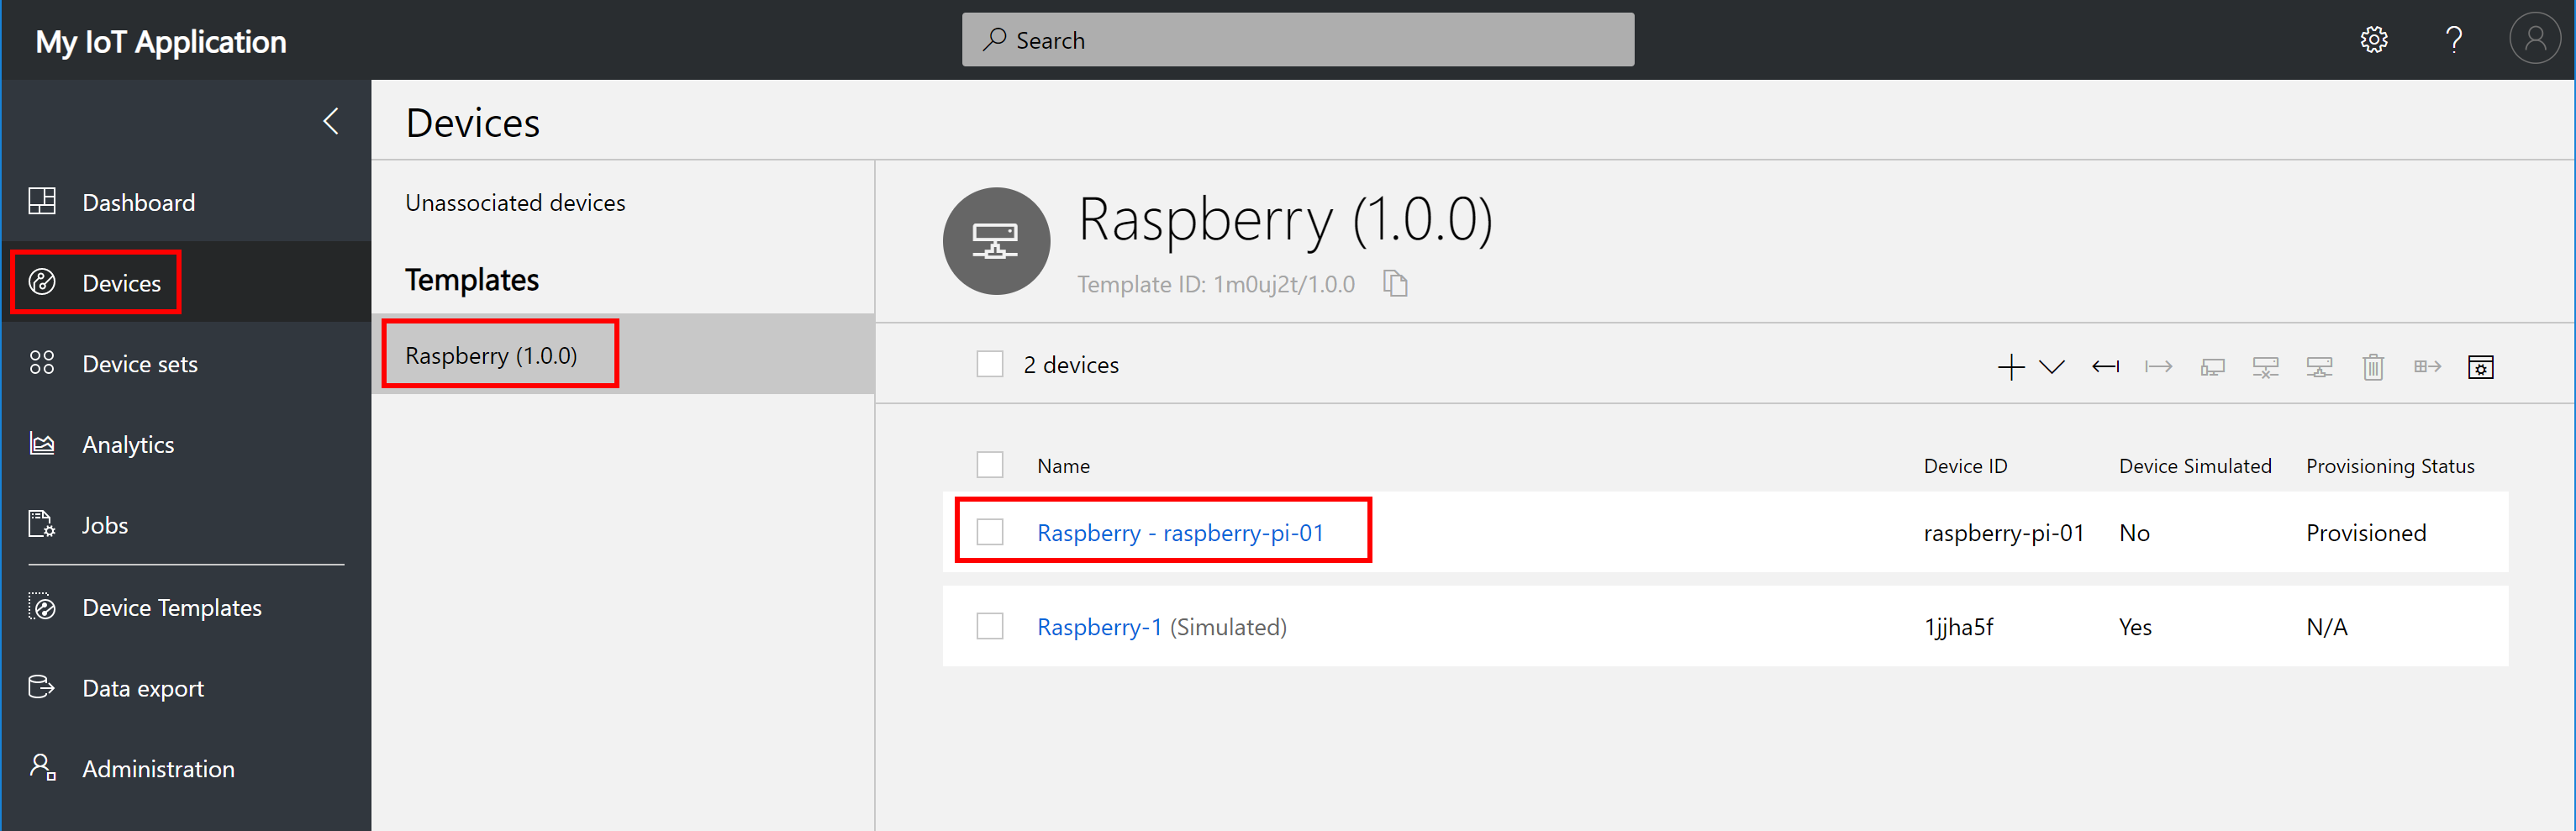
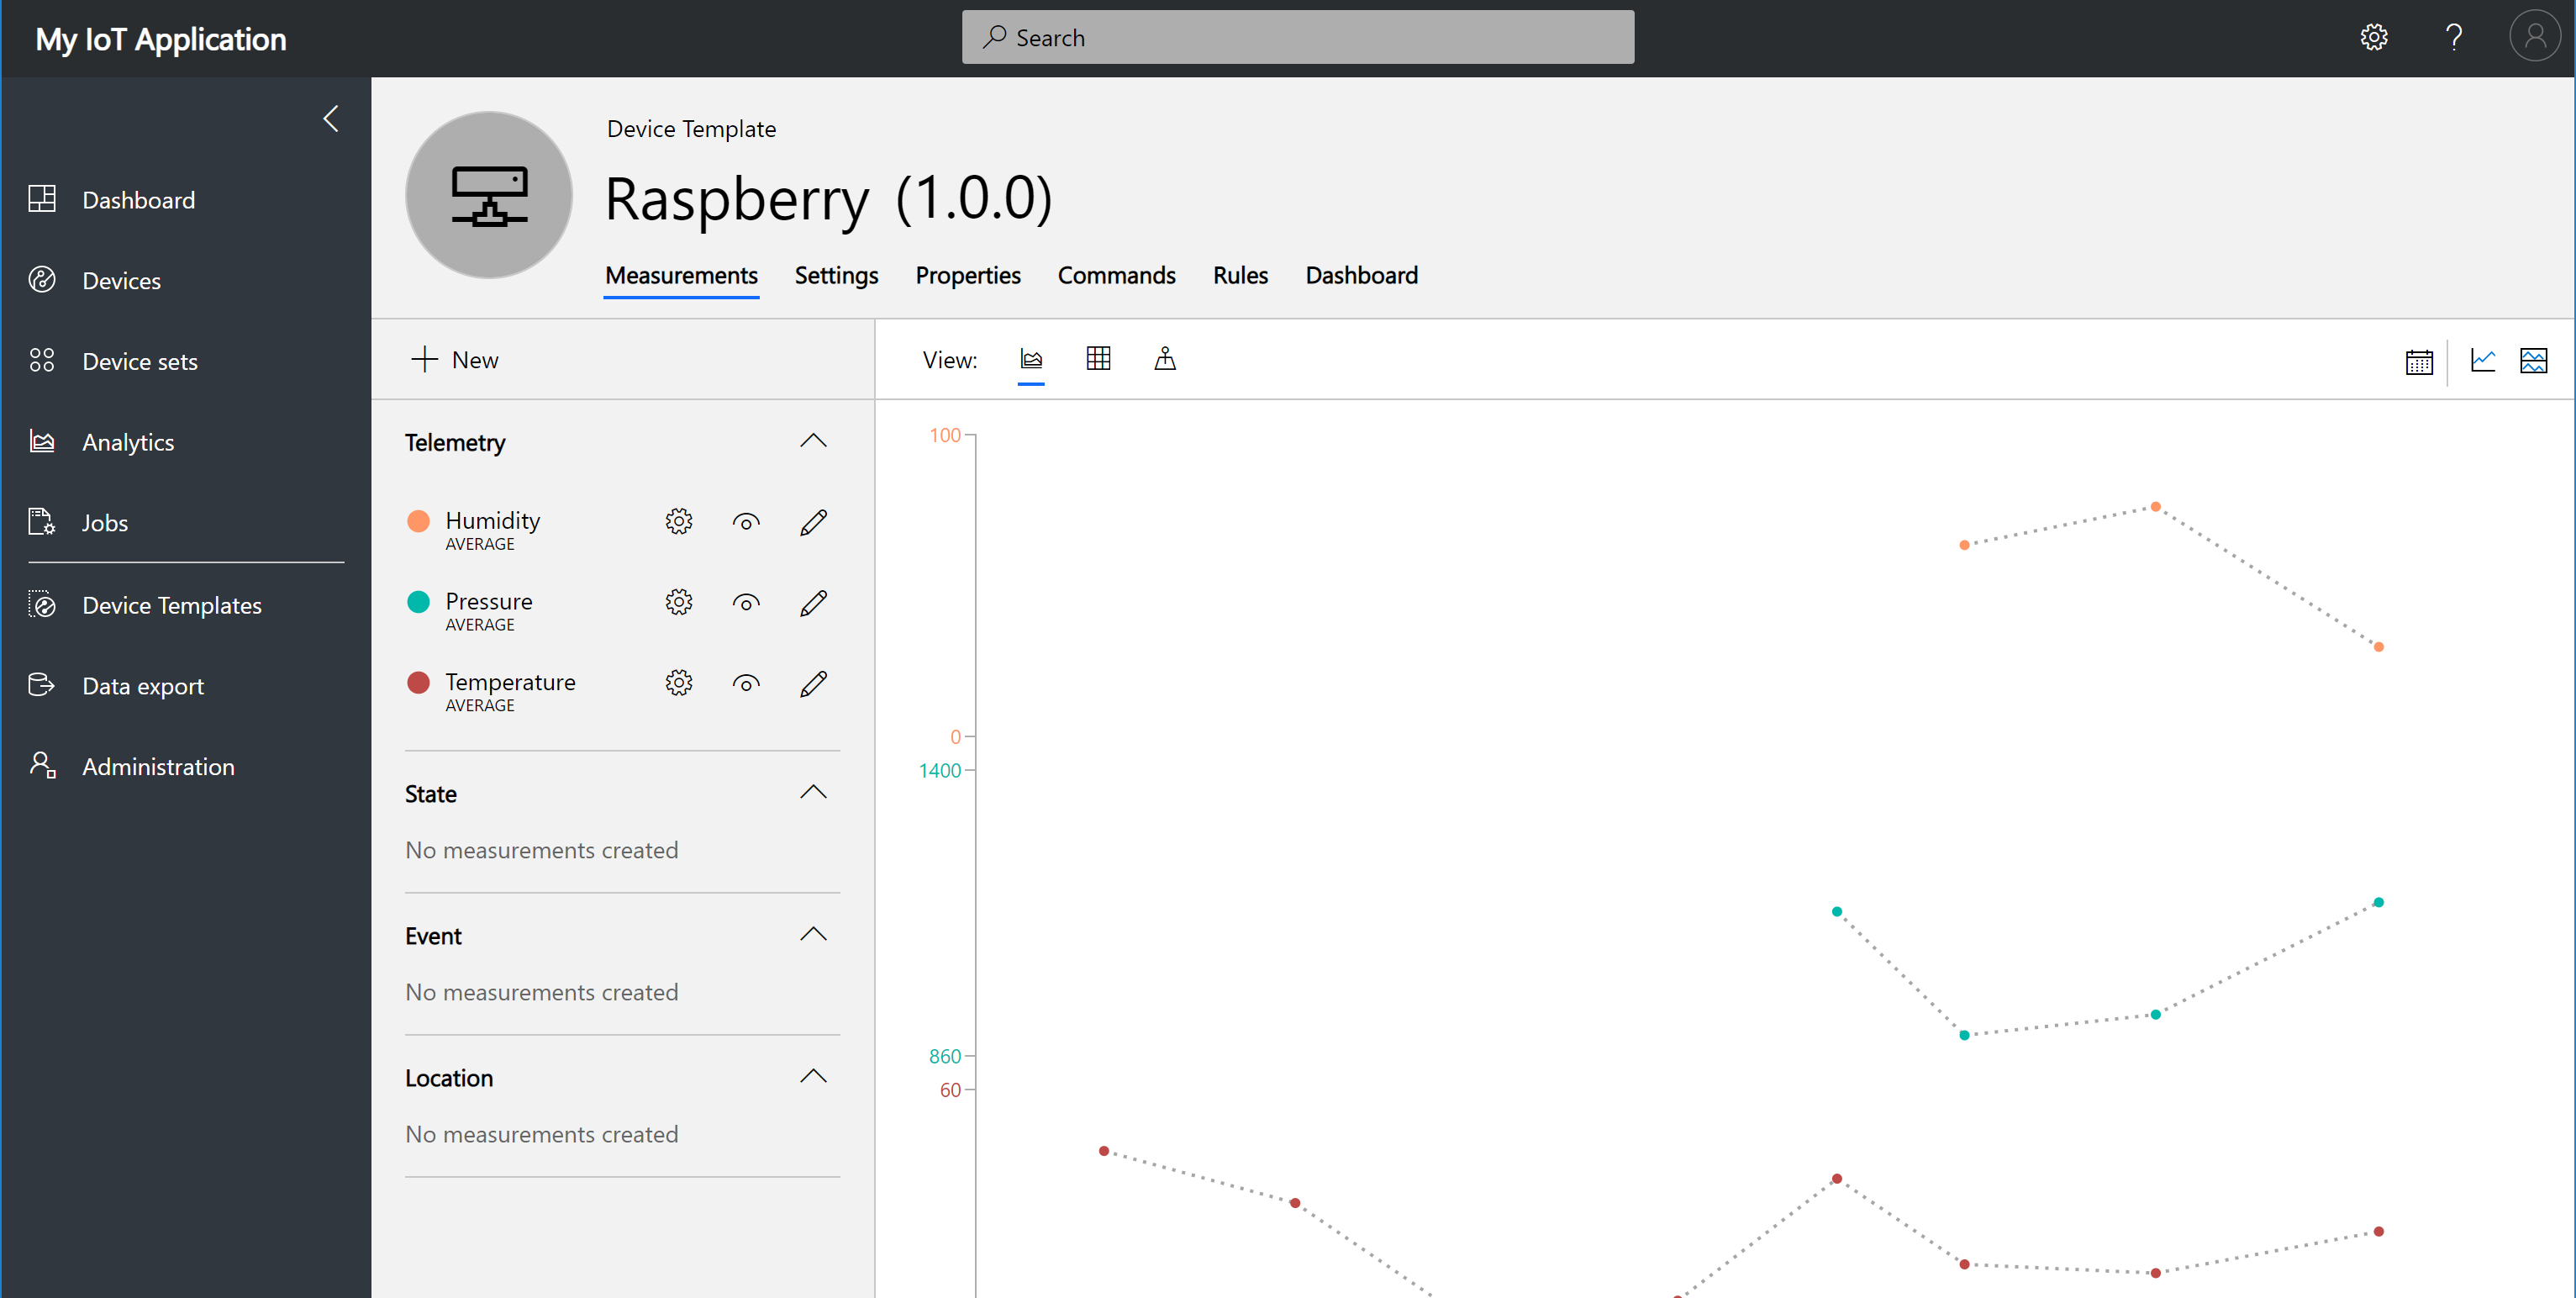
-
On the Measurements page, you can see the telemetry streaming from the Raspberry Pi device:
Finished

Appendix
Debugger Configuration
There are two files (launch.json and tasks.json) found in the .vscode folder that are responsible for the running and debugging the application.
Launch Configuration
Creating a launch configuration file is useful as it allows you to configure and save debugging setup details.
launch.json
{
    // Use IntelliSense to learn about possible attributes.
    // Hover to view descriptions of existing attributes.
    // For more information, visit: https://go.microsoft.com/fwlink/?linkid=830387
    "version": "0.2.0",
    "configurations": [
        {
            "name": "Attach Debugger",
            "preLaunchTask": "start-docker",
            "postDebugTask": "stop-docker",
            "type": "python",
            "request": "attach",
            "pathMappings": [
                {
                    "localRoot": "${workspaceRoot}/app",
                    "remoteRoot": "/app"
                }
            ],
            "port": "${env:LAB_PORT}",
            "host": "localhost"
        },
        {
            "name": "Stop Container",
            "preLaunchTask": "stop-docker",
            "type": "python",
            "request": "launch"
        }
    ]
}
Tasks Configuration
Tasks integrate external tools to automate build cycle.
tasks.json
{
    // See https://go.microsoft.com/fwlink/?LinkId=733558
    // for the documentation about the tasks.json format
    "version": "2.0.0",
    "tasks": [
        {
            "label": "start-docker",
            "type": "shell",
            "command": "sh",
            "args": [
                "-c",
                "\"docker build -t $USER:latest . ;docker run -d -p $LAB_PORT:3000 -e TELEMETRY_HOST=$LAB_HOST --env-file env-file --name $USER --rm  $USER:latest; sleep 1 \""
                // -d Run container in background and print container ID,
                // -p maps the $LAB_PORT to port 3000 in the container, this port is used for debugging,
                // -e Environment Variable. The IP Address of the telemetry service.
                // --env-file reads from a file and sets Environment Variables in the Docker Container,
                // --name names the Docker Container
                // --rm removes the container when you stop it
                // Docker run reference https://docs.docker.com/engine/reference/run/
            ],
        },
        {
            "label": "stop-docker",
            "type": "shell",
            "command": "sh",
            "args": [
                "-c",
                "\"docker stop $USER\""
            ]
        }
    ]
}
Azure IoT Central
Take a tour of the Azure IoT Central UI
This article introduces you to the Microsoft Azure IoT Central UI. You can use the UI to create, manage, and use an Azure IoT Central solution and its connected devices.
As a builder, you use the Azure IoT Central UI to define your Azure IoT Central solution. You can use the UI to:
- Define the types of device that connect to your solution.
- Configure the rules and actions for your devices.
- Customize the UI for an operator who uses your solution.
As an operator, you use the Azure IoT Central UI to manage your Azure IoT Central solution. You can use the UI to:
- Monitor your devices.
- Configure your devices.
- Troubleshoot and remediate issues with your devices.
- Provision new devices.
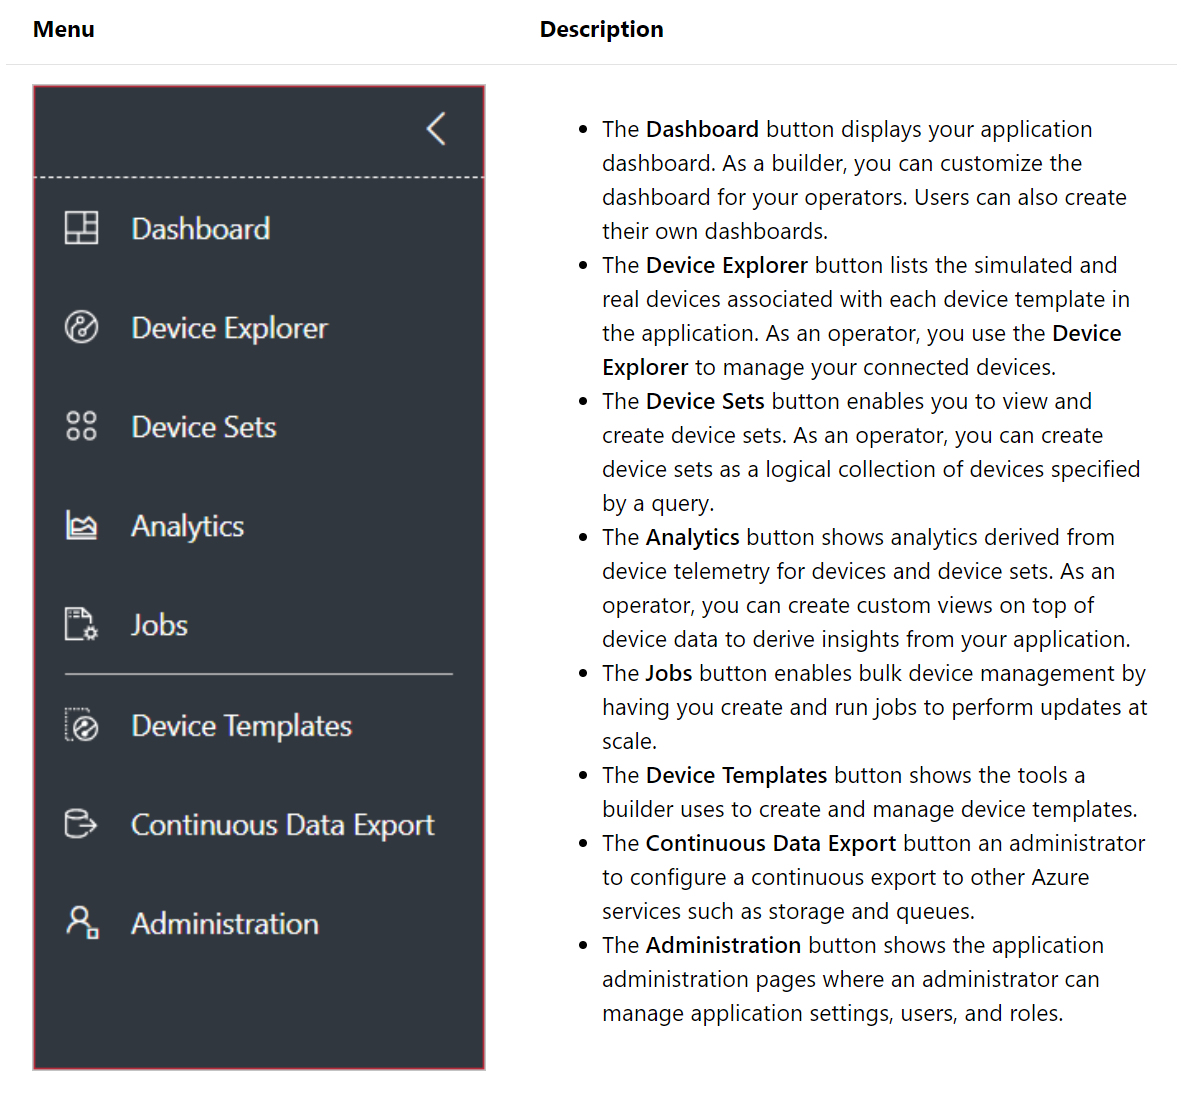
Use the left navigation menu
Use the left navigation menu to access the different areas of the application. You can expand or collapse the navigation bar by selecting < or >:
Search, help, and support
The top menu appears on every page:

- To search for device templates and devices, enter a Search value.
- To change the UI language or theme, choose the Settings icon.
- To sign out of the application, choose the Account icon.
- To get help and support, choose the Help drop-down for a list of resources. In a trial application, the support resources include access to live chat.
You can choose between a light theme or a dark theme for the UI:
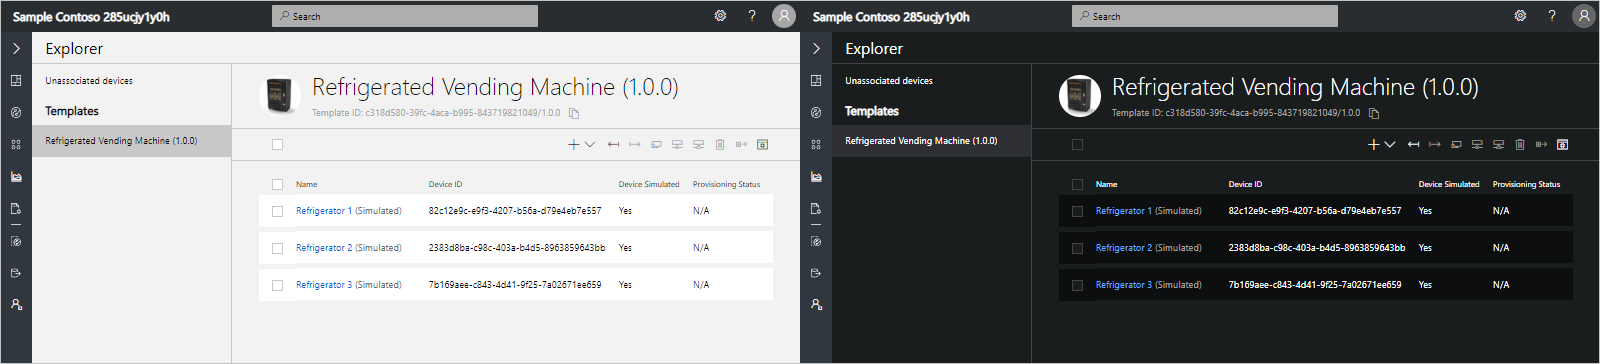
Dashboard
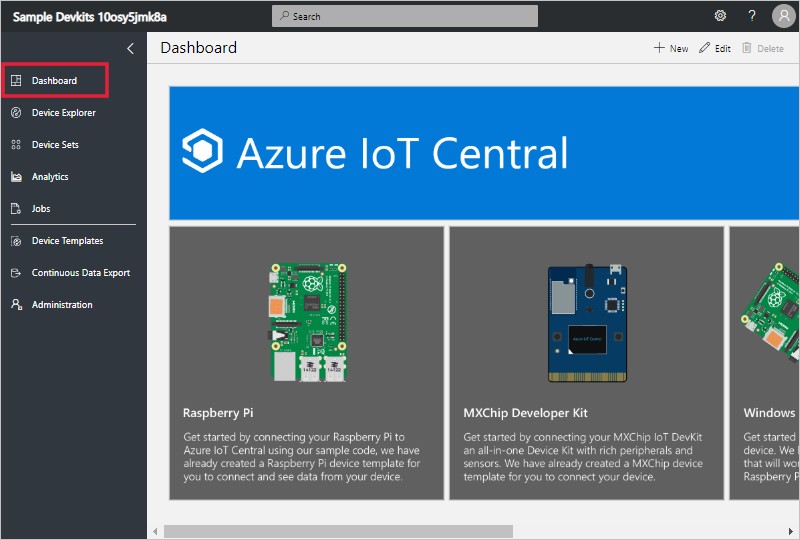
The dashboard is the first page you see when you sign in to your Azure IoT Central application. As a builder, you can customize the application dashboard for other users by adding tiles. To learn more, see the Customize the Azure IoT Central operator’s view tutorial. Users can also create their own personal dashboards.
Device explorer
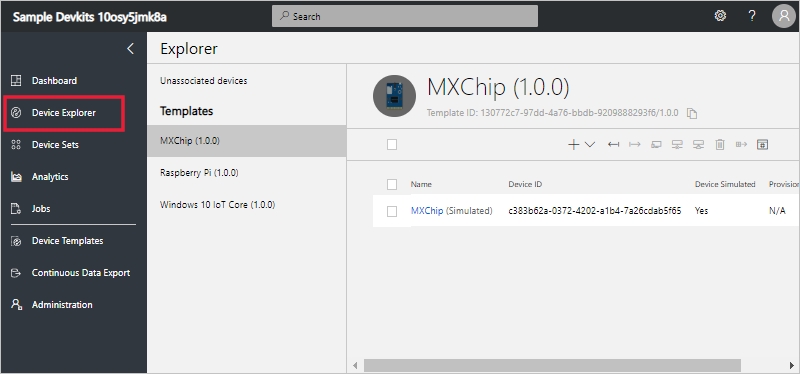
The explorer page shows the devices in your Azure IoT Central application grouped by device template.
- A device template defines a type of device that can connect to your application. To learn more, see the Define a new device type in your Azure IoT Central application.
- A device represents either a real or simulated device in your application. To learn more, see the Add a new device to your Azure IoT Central application.
Device sets
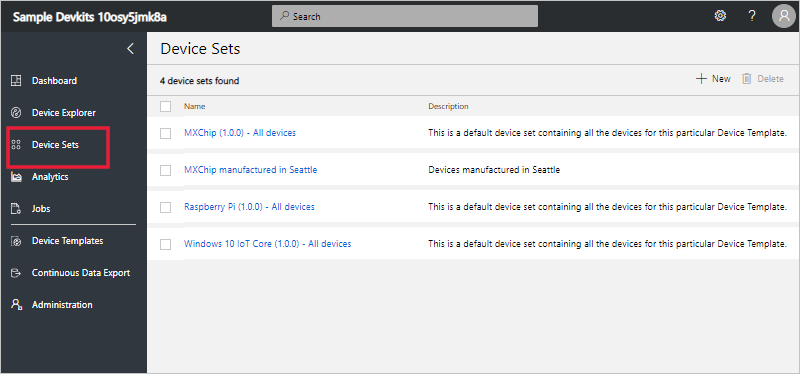
The device sets page shows device sets created by the builder. A device set is a collection of related devices. A builder defines a query to identify the devices that are included in a device set. You use device sets when you customize the analytics in your application. To learn more, see the Use device sets in your Azure IoT Central application article.
Device Templates
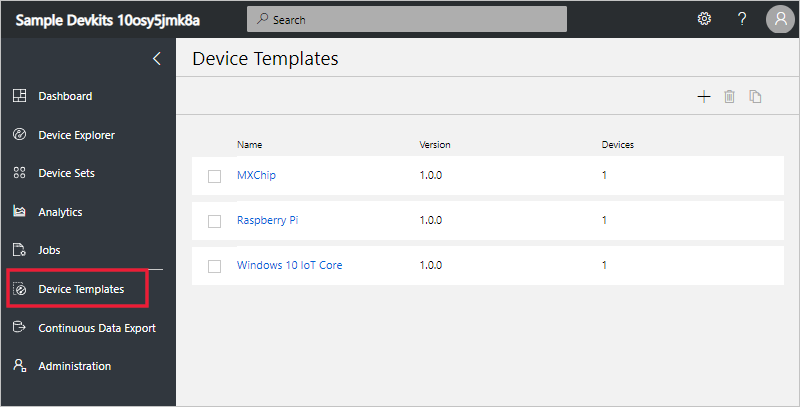
The device templates page is where a builder creates and manages the device templates in the application. To learn more, see the Define a new device type in your Azure IoT Central application tutorial.
Analytics
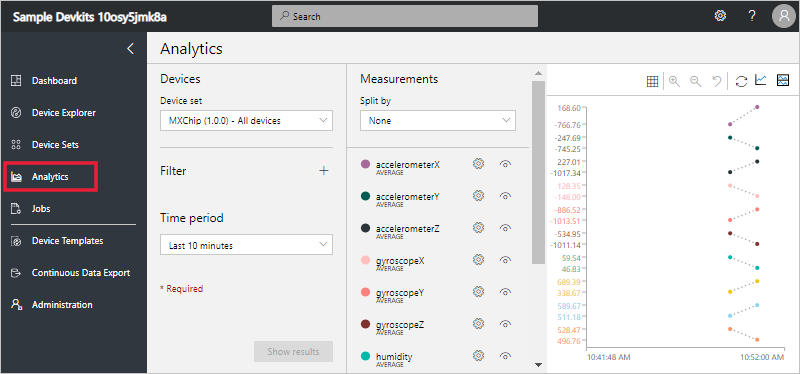
The analytics page shows charts that help you understand how the devices connected to your application are behaving. An operator uses this page to monitor and investigate issues with connected devices. The builder can define the charts shown on this page. To learn more, see the Create custom analytics for your Azure IoT Central application article.
Jobs
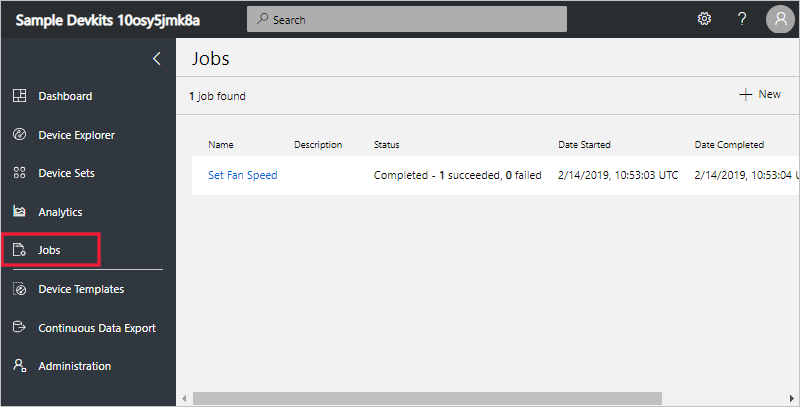
The jobs page allows you to perform bulk device management operations onto your devices. The builder uses this page to update device properties, settings, and commands. To learn more, see the Run a job article.
Continuous Data Export
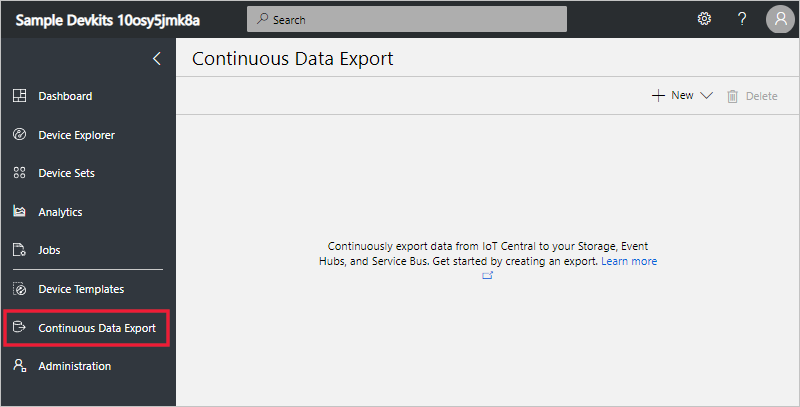
The continuous data export page is where an administrator defines how to export data, such as telemetry, from the application. Other services can store the exported data or use it for analysis. To learn more, see the Export your data in Azure IoT Central article.
Administration
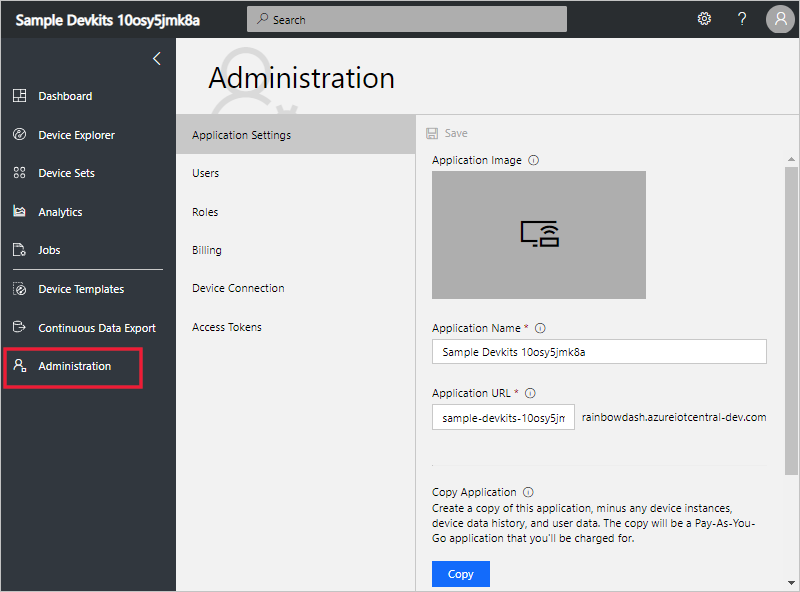
The administration page contains links to the tools an administrator uses such as defining users and roles in the application. To learn more, see the Administer your Azure IoT Central application article.