Front panel programming
The original Altair 8800 was programmed directly on the front panel. It was a painstaking, error-prone process to load and run a program. The Altair 8800 had a series of LEDs and switches for loading apps and determining the state of the machine.
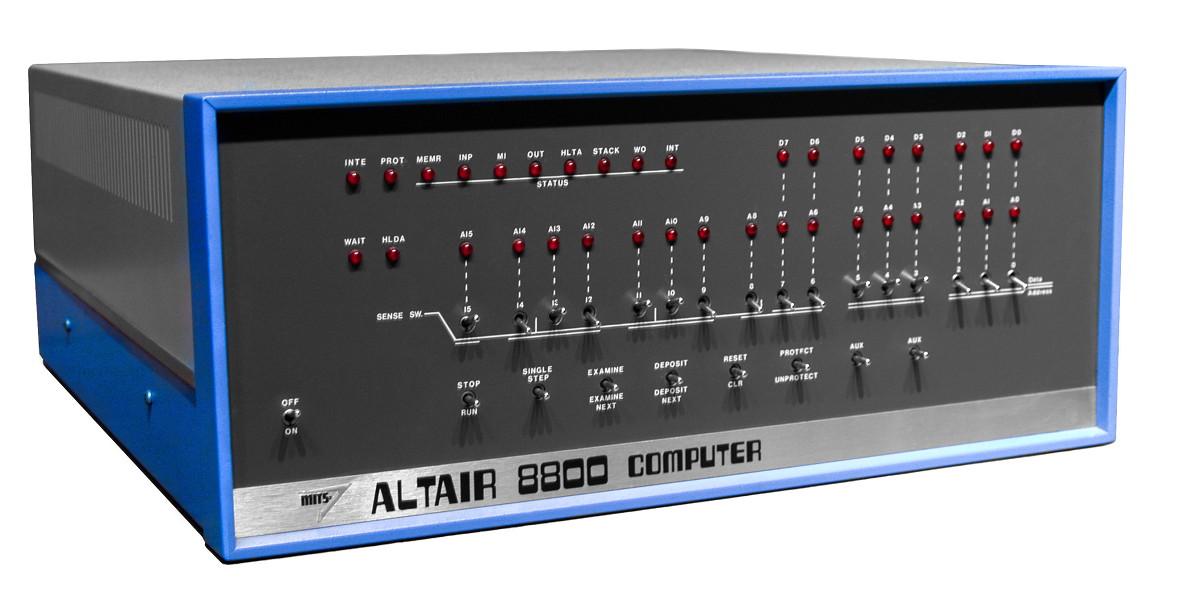
Altair 8800 image attribution - Smithsonian Museum
Programming the Altair emulator by using the front panel and Intel opcodes is a great way for you to understand how computers work.
Raspberry Pi Sense HAT LED Panel
Programming the Altair emulator with the virtual front panel is best experienced running the Altair emulator on a Raspberry Pi with a Pi Sense HAT attached.
Virtual front panel
To access the virtual front panel, you must be connected to the Altair emulator via the web terminal.
In the following procedure, you're directly setting memory addresses. You might overwrite something important and crash the Altair emulator. If this happens, just reboot the Altair and experiment again.
From the web terminal, select Ctrl+M to enter the CPU monitor.
You can enter binary strings to represent the switches on a real Altair front panel. For example, if you type 0000000011110000 and then select the Enter key, you set 12 switches off and 4 switches on.
Use the following letters to emulate the Altair front panel switches:
- e = EXAMINE
- en = EXAMINE NEXT
- d = DEPOSIT
- dn = DEPOSIT NEXT
- s = SINGLE STEP
If you want to load the 3-byte Intel 8080 Jmp at address 0x0100, use the following sequence of commands. Be sure to select Enter after you finish typing each instruction.
- Enter 100000000 (0x0100).
- Enter e to set the CPU current instruction pointer to address 0x0100.
- Enter 11000011, the Intel 8080 opcode for Jmp.
- Enter d to deposit the instruction at address 0x0000.
- Enter 0 to set the low order address for the Jmp instruction.
- Enter dn to increment the CPU instruction pointer to the next address location and deposit the high-order byte of the Jmp instruction.
- Enter 0 to set the high order address for the Jmp instruction.
- Enter dn again to increment the CPU instruction pointer to the next address location and deposit the high-order byte of the Jmp instruction.
To execute the instructions that you entered:
Enter 100000000 (0x0100).
Enter e to set the CPU instruction pointer to address 0x0100.
Enter s to SINGLE STEP the CPU.
Enter s again to SINGLE STEP the CPU. The CPU address is now s0x0000 after execution of the jump to address 0x0000.
Single step: Address bus: 00000000 00000000 (0x0000), Data bus 11000011 (0xc3), JMP adr (3 byte instruction)
To exit the CPU monitor, select Ctrl+M.
The List virtual front panel command
This is an extended Altair front panel command.
The List command will disassemble the next 20 Intel 8080 instructions from the current CPU instruction pointer set by the EXAMINE switch. To use the List command follow these steps.
From the web terminal, list the DEMO.ASM file. Note the first instruction, this application will be loaded at address 0100H (100000000 binary)
type demo.asmORG 0100H ; CP/M base of TPA (transient program area)
OUT 30
MVI C,09H ; Print string function
LXI D,MESSAGE ; Point
CALL 0005H ; Call bdos
RET ; To cp/m
MESSAGE:DB 0DH,0AH,'Hello, World!',0DH,0AH,'$'
ENDRun the demo application, this will load the demo application at address 100H (100000000 binary) and then execute the application.
demoFrom the web terminal, select Ctrl+M to enter the CPU monitor.
Set the CPU instruction pointer to 100H, type 100000000, and then select Enter.
100000000The CPU monitor will display the following text.
CPU MONITOR> 100000000
        Input: 00000001 00000000 (0x0100), NOP (1 byte instruction)
Flick the virtual EXAMINE switch by typing E followed by Enter. This will set the CPU's current instruction pointer to 100H. The CPU monitor will display the following text.
CPU MONITOR> e
        Examine: Address bus: 0000000100000000 (0x0100), Data bus 11010011 (0xd3), OUT D8           (2 byte instruction)
Type L, and press Enter. This will disassemble the next 20 Intel 8080 instructions. Compare the disassembly with the code in DEMO.ASM.
Note, that the CPU instruction pointer will be returned to 100H after the disassembly.
Disassemble: Address bus: 0000000100000000 (0x0100), Data bus 11010011 (0xd3), OUT D8           (2 byte instruction)
Disassemble: Address bus: 0000000100000001 (0x0101), Data bus 00011110 (0x1e)
Disassemble: Address bus: 0000000100000010 (0x0102), Data bus 00001110 (0x0e), MVI C,D8         (2 byte instruction)
Disassemble: Address bus: 0000000100000011 (0x0103), Data bus 00001001 (0x09)
Disassemble: Address bus: 0000000100000100 (0x0104), Data bus 00010001 (0x11), LXI D,D16        (3 byte instruction)
Disassemble: Address bus: 0000000100000101 (0x0105), Data bus 00001011 (0x0b)
Disassemble: Address bus: 0000000100000110 (0x0106), Data bus 00000001 (0x01)
Disassemble: Address bus: 0000000100000111 (0x0107), Data bus 11001101 (0xcd), CALL adr         (3 byte instruction)
Disassemble: Address bus: 0000000100001000 (0x0108), Data bus 00000101 (0x05)
Disassemble: Address bus: 0000000100001001 (0x0109), Data bus 00000000 (0x00)
Disassemble: Address bus: 0000000100001010 (0x010a), Data bus 11001001 (0xc9), RET              (1 byte instruction)
Disassemble: Address bus: 0000000100001011 (0x010b), Data bus 00001101 (0x0d), DCR C            (1 byte instruction)
Disassemble: Address bus: 0000000100001100 (0x010c), Data bus 00001010 (0x0a), LDAX B           (1 byte instruction)
Disassemble: Address bus: 0000000100001101 (0x010d), Data bus 01001000 (0x48), MOV C,B          (1 byte instruction)
Disassemble: Address bus: 0000000100001110 (0x010e), Data bus 01100101 (0x65), MOV H,L          (1 byte instruction)
Disassemble: Address bus: 0000000100001111 (0x010f), Data bus 01101100 (0x6c), MOV L,H          (1 byte instruction)
Disassemble: Address bus: 0000000100010000 (0x0110), Data bus 01101100 (0x6c), MOV L,H          (1 byte instruction)
Disassemble: Address bus: 0000000100010001 (0x0111), Data bus 01101111 (0x6f), MOV L,A          (1 byte instruction)
Disassemble: Address bus: 0000000100010010 (0x0112), Data bus 00101100 (0x2c), INR L            (1 byte instruction)
Disassemble: Address bus: 0000000100010011 (0x0113), Data bus 00100000 (0x20), -                (0 byte instruction)
Disassemble: Address bus: 0000000100010100 (0x0114), Data bus 01010111 (0x57), MOV D,A          (1 byte instruction)
Disassemble: Address bus: 0000000100010101 (0x0115), Data bus 01101111 (0x6f), MOV L,A          (1 byte instruction)
Disassemble: Address bus: 0000000100010110 (0x0116), Data bus 01110010 (0x72), MOV M,D          (1 byte instruction)
Disassemble: Address bus: 0000000100010111 (0x0117), Data bus 01101100 (0x6c), MOV L,H          (1 byte instruction)
Disassemble: Address bus: 0000000100011000 (0x0118), Data bus 01100100 (0x64), MOV H,H          (1 byte instruction)
Disassemble: Address bus: 0000000100011001 (0x0119), Data bus 00100001 (0x21), LXI H,D16        (3 byte instruction)
Disassemble: Address bus: 0000000100011010 (0x011a), Data bus 00001101 (0x0d)
Disassemble: Address bus: 0000000100011011 (0x011b), Data bus 00001010 (0x0a)
From the web terminal, select Ctrl+M to exit the CPU monitor. This will resume code execution from the current CPU instruction pointer. Depending on what you have been changing in memory, you may need to restart CP/M.
The Trace virtual front panel command
This is an extended Altair front panel command.
The trace command disassembles while executing the next 20 instructions from the current CPU instruction point. When the trace completes, the current CPU instruction pointer will point to the next instruction to be executed.
Run the demo application, this will load the demo application at address 100H (100000000 binary) and then execute the application.
demoFrom the web terminal, select Ctrl+M to enter the CPU monitor.
Set the CPU instruction pointer to 100H, type and then press Enter.
100000000The CPU monitor will display the following text.
CPU MONITOR> 100000000
        Input: 00000001 00000000 (0x0100), NOP (1 byte instruction)
Flick the virtual EXAMINE switch by typing E followed by Enter. This will set the CPU's current instruction pointer to 100H. The CPU monitor will display the following text.
CPU MONITOR> e
        Examine: Address bus: 0000000100000000 (0x0100), Data bus 11010011 (0xd3), OUT D8           (2 byte instruction)
Type T, and press Enter. This will start a trace of the next 20 Intel 8080 instructions, following the execution path of the code in memory.
Trace: Address bus: 0000000100000000 (0x0100), Data bus 11010011 (0xd3), OUT D8           (2 byte instruction)
Trace: Address bus: 0000000100000001 (0x0101), Data bus 00011110 (0x1e)
Trace: Address bus: 0000000100000010 (0x0102), Data bus 00001110 (0x0e), MVI C,D8         (2 byte instruction)
Trace: Address bus: 0000000100000011 (0x0103), Data bus 00001001 (0x09)
Trace: Address bus: 0000000100000100 (0x0104), Data bus 00010001 (0x11), LXI D,D16        (3 byte instruction)
Trace: Address bus: 0000000100000101 (0x0105), Data bus 00001011 (0x0b)
Trace: Address bus: 0000000100000110 (0x0106), Data bus 00000001 (0x01)
Trace: Address bus: 0000000100000111 (0x0107), Data bus 11001101 (0xcd), CALL adr         (3 byte instruction)
Trace: Address bus: 0000000100001000 (0x0108), Data bus 00000101 (0x05)
Trace: Address bus: 0000000100001001 (0x0109), Data bus 00000000 (0x00)
Trace: Address bus: 0000000000000101 (0x0005), Data bus 11000011 (0xc3), JMP adr          (3 byte instruction)
Trace: Address bus: 0000000000000110 (0x0006), Data bus 00000110 (0x06)
Trace: Address bus: 0000000000000111 (0x0007), Data bus 11100111 (0xe7)
Trace: Address bus: 1110011100000110 (0xe706), Data bus 11000011 (0xc3), JMP adr          (3 byte instruction)
Trace: Address bus: 1110011100000111 (0xe707), Data bus 00010001 (0x11)
Trace: Address bus: 1110011100001000 (0xe708), Data bus 11100111 (0xe7)
Trace: Address bus: 1110011100010001 (0xe711), Data bus 11101011 (0xeb), XCHG             (1 byte instruction)
Trace: Address bus: 1110011100010010 (0xe712), Data bus 00100010 (0x22), SHLD adr         (3 byte instruction)
Trace: Address bus: 1110011100010011 (0xe713), Data bus 01000011 (0x43)
Trace: Address bus: 1110011100010100 (0xe714), Data bus 11101010 (0xea)
Trace: Address bus: 1110011100010101 (0xe715), Data bus 11101011 (0xeb), XCHG             (1 byte instruction)
Trace: Address bus: 1110011100010110 (0xe716), Data bus 01111011 (0x7b), MOV A,E          (1 byte instruction)
Trace: Address bus: 1111010011010110 (0xf4d6), Data bus 00001011 (0x0b), DCX B            (1 byte instruction)
Trace: Address bus: 1110011100011010 (0xe71a), Data bus 00100001 (0x21), LXI H,D16        (3 byte instruction)
Trace: Address bus: 1110011100011011 (0xe71b), Data bus 00000000 (0x00)
Trace: Address bus: 1110011100011100 (0xe71c), Data bus 00000000 (0x00)
Trace: Address bus: 1110011100011101 (0xe71d), Data bus 00100010 (0x22), SHLD adr         (3 byte instruction)
Trace: Address bus: 1110011100011110 (0xe71e), Data bus 01000101 (0x45)
Trace: Address bus: 1110011100011111 (0xe71f), Data bus 11101010 (0xea)
Trace: Address bus: 1110011100100000 (0xe720), Data bus 00111001 (0x39), DAD SP           (1 byte instruction)
Trace: Address bus: 1110011100100001 (0xe721), Data bus 00100010 (0x22), SHLD adr         (3 byte instruction)
Trace: Address bus: 1110011100100010 (0xe722), Data bus 00001111 (0x0f)
Trace: Address bus: 1110011100100011 (0xe723), Data bus 11101010 (0xea)
Trace: Address bus: 1110011100100100 (0xe724), Data bus 00110001 (0x31), LXI SP, D16      (3 byte instruction)
Trace: Address bus: 1110011100100101 (0xe725), Data bus 01000001 (0x41)
Trace: Address bus: 1110011100100110 (0xe726), Data bus 11101010 (0xea)
Trace: Address bus: 1110011100100111 (0xe727), Data bus 10101111 (0xaf), XRA A            (1 byte instruction)
Trace: Address bus: 1111010011100000 (0xf4e0), Data bus 00000000 (0x00), NOP              (1 byte instruction)
Trace: Address bus: 1111010011011110 (0xf4de), Data bus 00000000 (0x00), NOP              (1 byte instruction)
Trace: Address bus: 1110011100101110 (0xe72e), Data bus 00100001 (0x21), LXI H,D16        (3 byte instruction)
Trace: Address bus: 1110011100101111 (0xe72f), Data bus 01110100 (0x74)
Trace: Address bus: 1110011100110000 (0xe730), Data bus 11110100 (0xf4)
From the web terminal, select Ctrl+M to exit the CPU monitor. This will resume code execution from the current CPU instruction pointer. Depending on what you have been changing in memory, you may need to reboot CP/M.
Loop example
Disassemble: Address bus: 0000000100000000 (0x0100), Data bus 11000011 (0xc3), JMP adr          (3 byte instruction)
Disassemble: Address bus: 0000000100000001 (0x0101), Data bus 00000011 (0x03)
Disassemble: Address bus: 0000000100000010 (0x0102), Data bus 00000001 (0x01)
Disassemble: Address bus: 0000000100000011 (0x0103), Data bus 11000011 (0xc3), JMP adr          (3 byte instruction)
Disassemble: Address bus: 0000000100000100 (0x0104), Data bus 00000000 (0x00)
Disassemble: Address bus: 0000000100000101 (0x0105), Data bus 00000001 (0x01)
``