Customize IoT Central
In this exercise, you will be customizing Azure IoT Central to display the data sent from the applications you run on the Altair emulator. Applications that stream data to Azure IoT Central include WEATHER.BAS and JSON.BAS.
Open the Azure IoT Central device explorer
Go to Azure IoT Central.
On the left pane, select Devices select your device.
It might take a minute or two for the Altair emulator device to register in the devices section of Azure IoT Central.
Customize the Climate monitor template
The Altair emulator supports IoT Plug and Play. When the Altair emulator connects to Azure IoT Central, the Climate Monitor Plug and Play model is loaded from the public repository of models. Default views are created for the Climate Monitor model. These default views are a great starting point, but they need customization along with some new views.
The IoT Plug and Play model is declared in the main.h file.
#define IOT_PLUG_AND_PLAY_MODEL_ID "dtmi:com:example:climatemonitor;1"
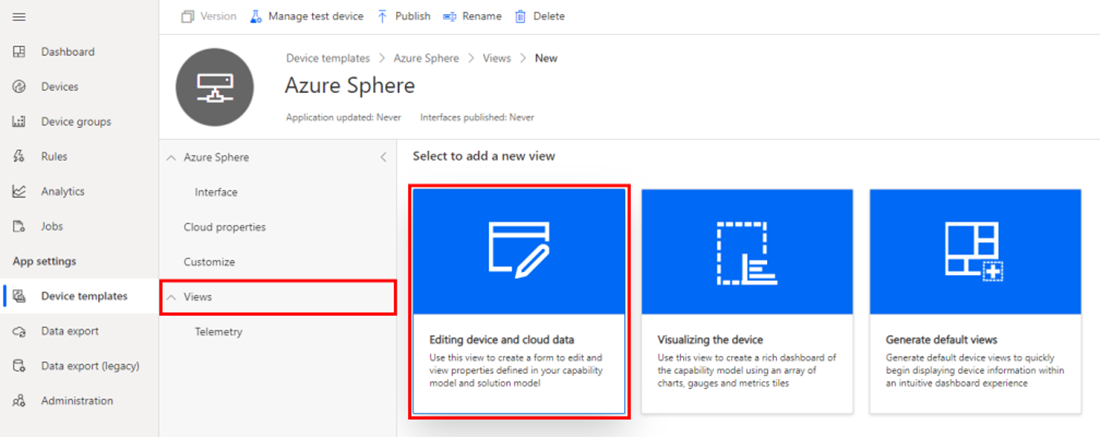
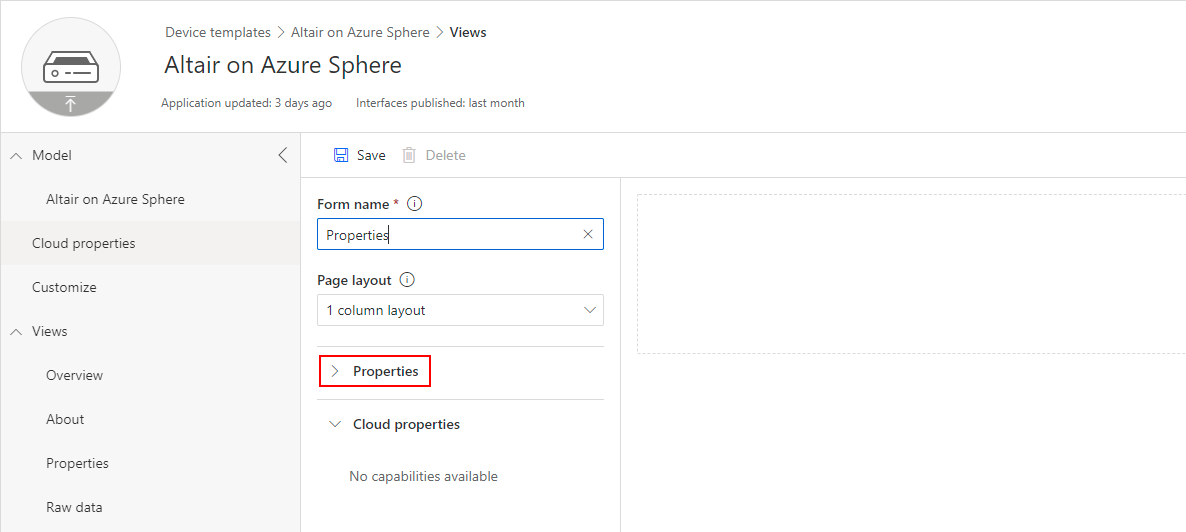
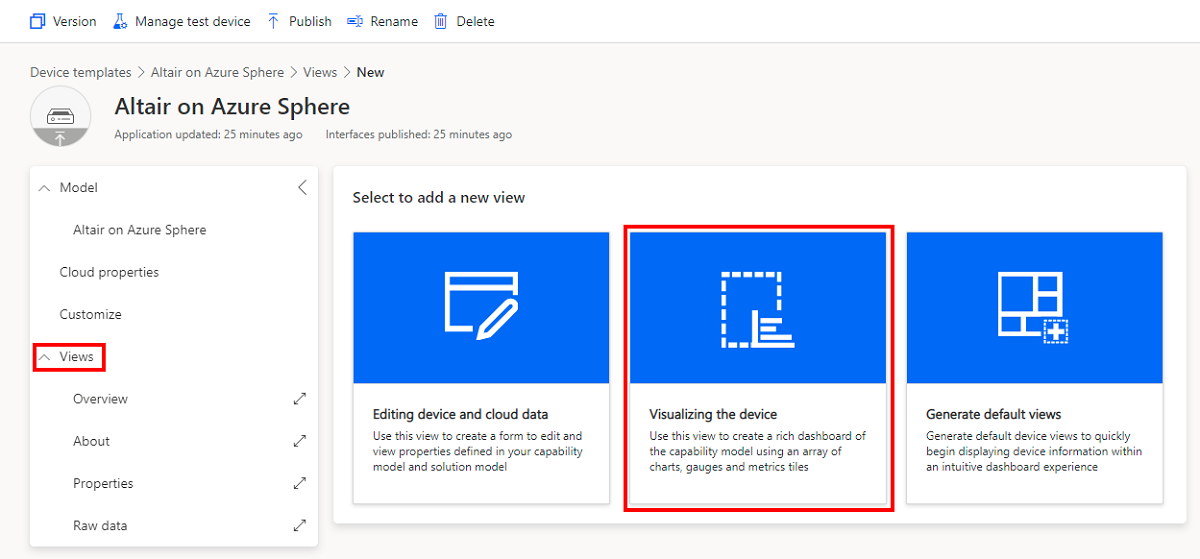
Add a summary properties view
On the left pane, select Views, and then select the Editing device and cloud data tile.
Name the form Summary.
Select 3 column layout.
Expand Properties.
Select the following properties:
- Humidity
- Pressure
- Temperature
- Weather
Select Add section.
Drag the newly added section in column 3 to column 1
Select the following properties:
- LED brightness
Select Add section.
Drag the newly added section in column 3 to column 1 below weather properties
Select the following properties:
- AirQualityIndexUS
- Ammonia
- CarbonMonoxide
- NitrogenDioxide
- NitrogenMonoxide
- Ozone
- PM10
- PM2_5
- SulphurDioxide
- Wind Speed
Select Add section.
Drag the newly added section in column 3 to column 2
Select the following properties:
- Heartbeat
- Software version
- Start time
Select Add section.
Select the following properties:
- City
- Country
- Location
Select Add section.
Your summary page layout should look like the following image.
Select Save.
Select Back.
Add a weather data visualization view
On the left pane, select Views, and then select the Visualizing the device tile.
Name the view Weather.
Select Line chart from the Start with a visual list, then select Add tile.
Select the Size available icon on the tile and select 3x3.
Select the Edit icon on the tile.
Name the chart Weather.
Select Past 12 hours from the Display range dropdown list.
Select Capability.
In the capability list, select temperature.
Select Capability.
In the capability list, select pressure.
Select Capability.
In the capability list, select humidity.
Select Capability.
In the capability list, select Wind speed.
Select Update.
Select Save.
Select Back.
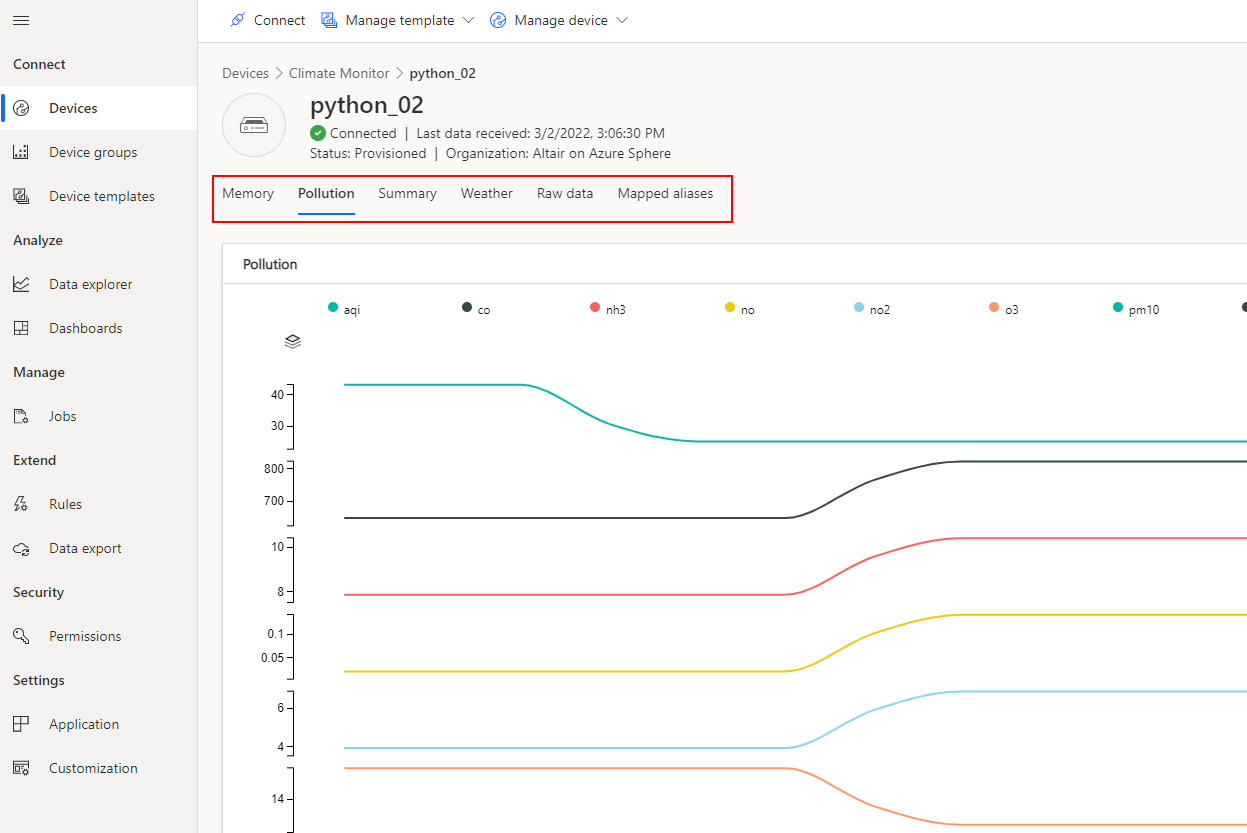
Add a pollution data visualization view
On the left pane, select Views, and then select the Visualizing the device tile.
Name the view pollution.
Select Line chart from the Start with a visual list, then select Add tile.
Select the Size available icon on the tile, and select 4x4.
Select the Edit icon on the tile.
Name the chart Pollution.
Select Past 12 hours from the Display range dropdown list.
Select Capability.
In the capability list, select aqi.
Repeat adding capabilities, and add the following capabilities.
- co (carbon monoxide)
- nh3 (ammonia)
- no (nitrous oxide)
- no2 (nitrous dioxide)
- o3 (ozone)
- pm10 (particulate matter 10)
- pm2_5 (particulate matter 2.5)
- so2 (sulphur dioxide)
- Wind speed
Notes. Pollutants produced by vehicle exhausts include carbon monoxide, hydrocarbons, nitrogen oxides, particles, volatile organic compounds, and sulfur dioxide. Hydrocarbons and nitrogen oxides react with sunlight and warm temperatures to form ground-level ozone. Ground-level ozone, a key ingredient in smog, can cause upper respiratory problems and lung damage.
- Select Update.
- Select Save.
- Select Back.
Customize the LED brightness property
If you have a Raspberry Pi with a Pi Sense HAT then customize the LED Brightness property. You can use this property to set the brightness of the Pi Sense HAT 8x8 LED panel.
On the left pane, select Device templates
On the left pane, select Customize, and then expand the LED brightness property.
Update the property by using the information from the following table
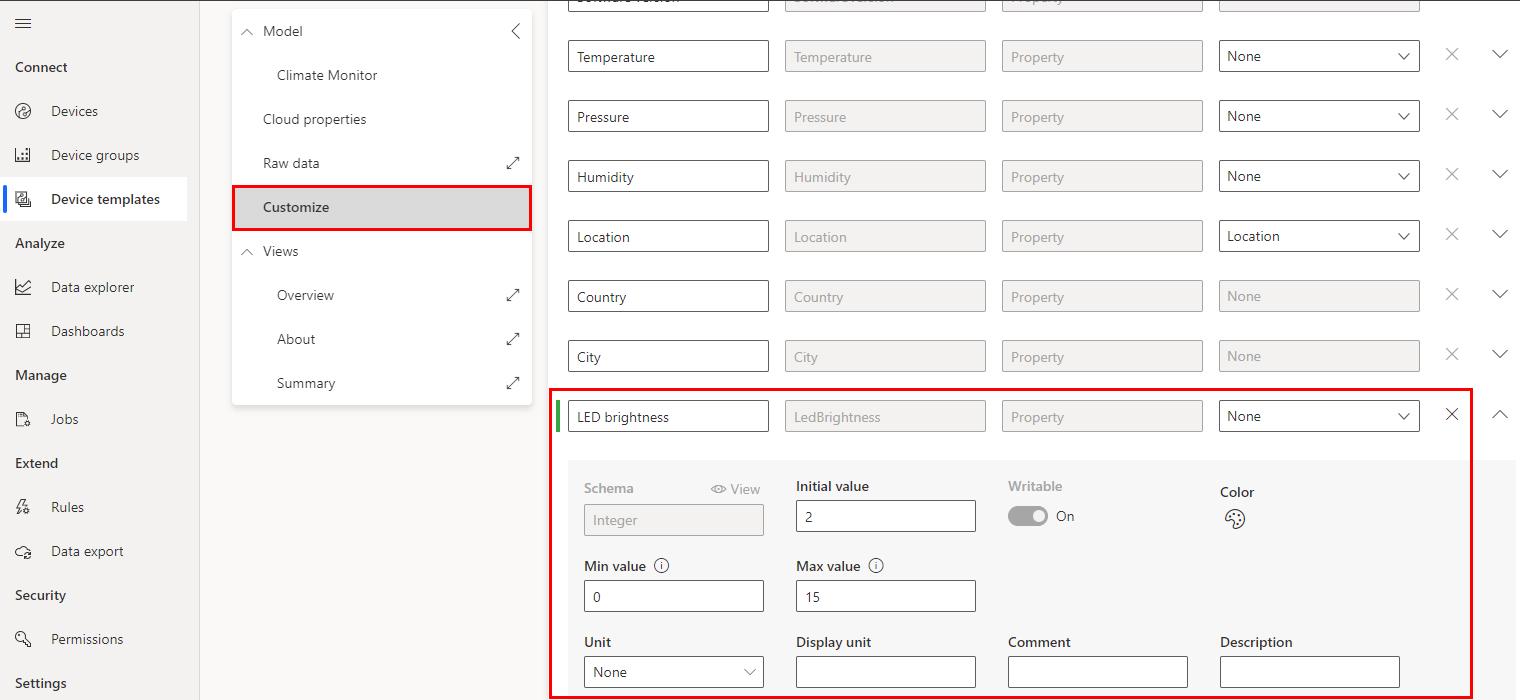
Display name Initial value Min. value Max. value True name False name LED brightness 2 0 15 n/a n/a Select Save.
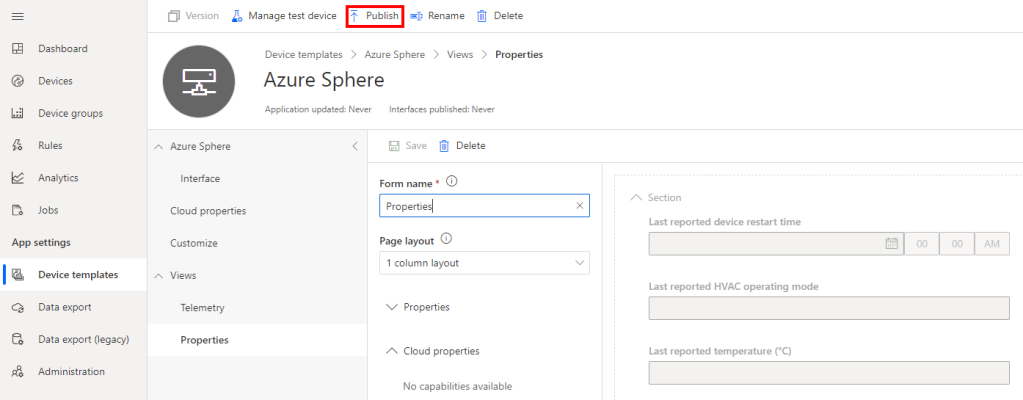
Publish the template
To publish the template to the Azure IoT Central application, select the Publish button.
View your Altair emulator device
On the left pane, select Devices, select the Climate monitor template and then select your device.
To explore the device views, select the various tabs.
Explore climate data from IoT Central
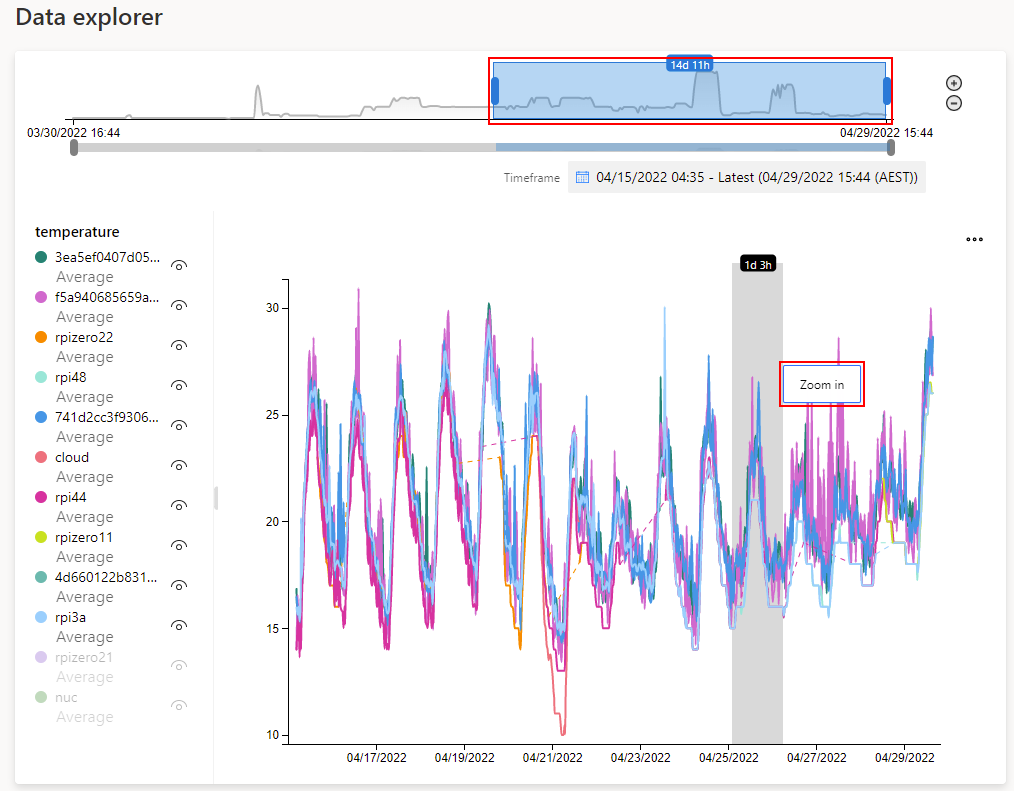
You can explore and analyze data from Azure IoT Central.
- On the left pane, select Data explorer.
- Select the + New Query.
- Select the Climate monitor Device group.
- Select the temperature Telemetry.
- Select Group by Device ID.
- Select Analyze.
- Select the data time frame you would like to explore.
- Select data time frame you would like to zoom into.